WeWork SPAC Presentation Deck
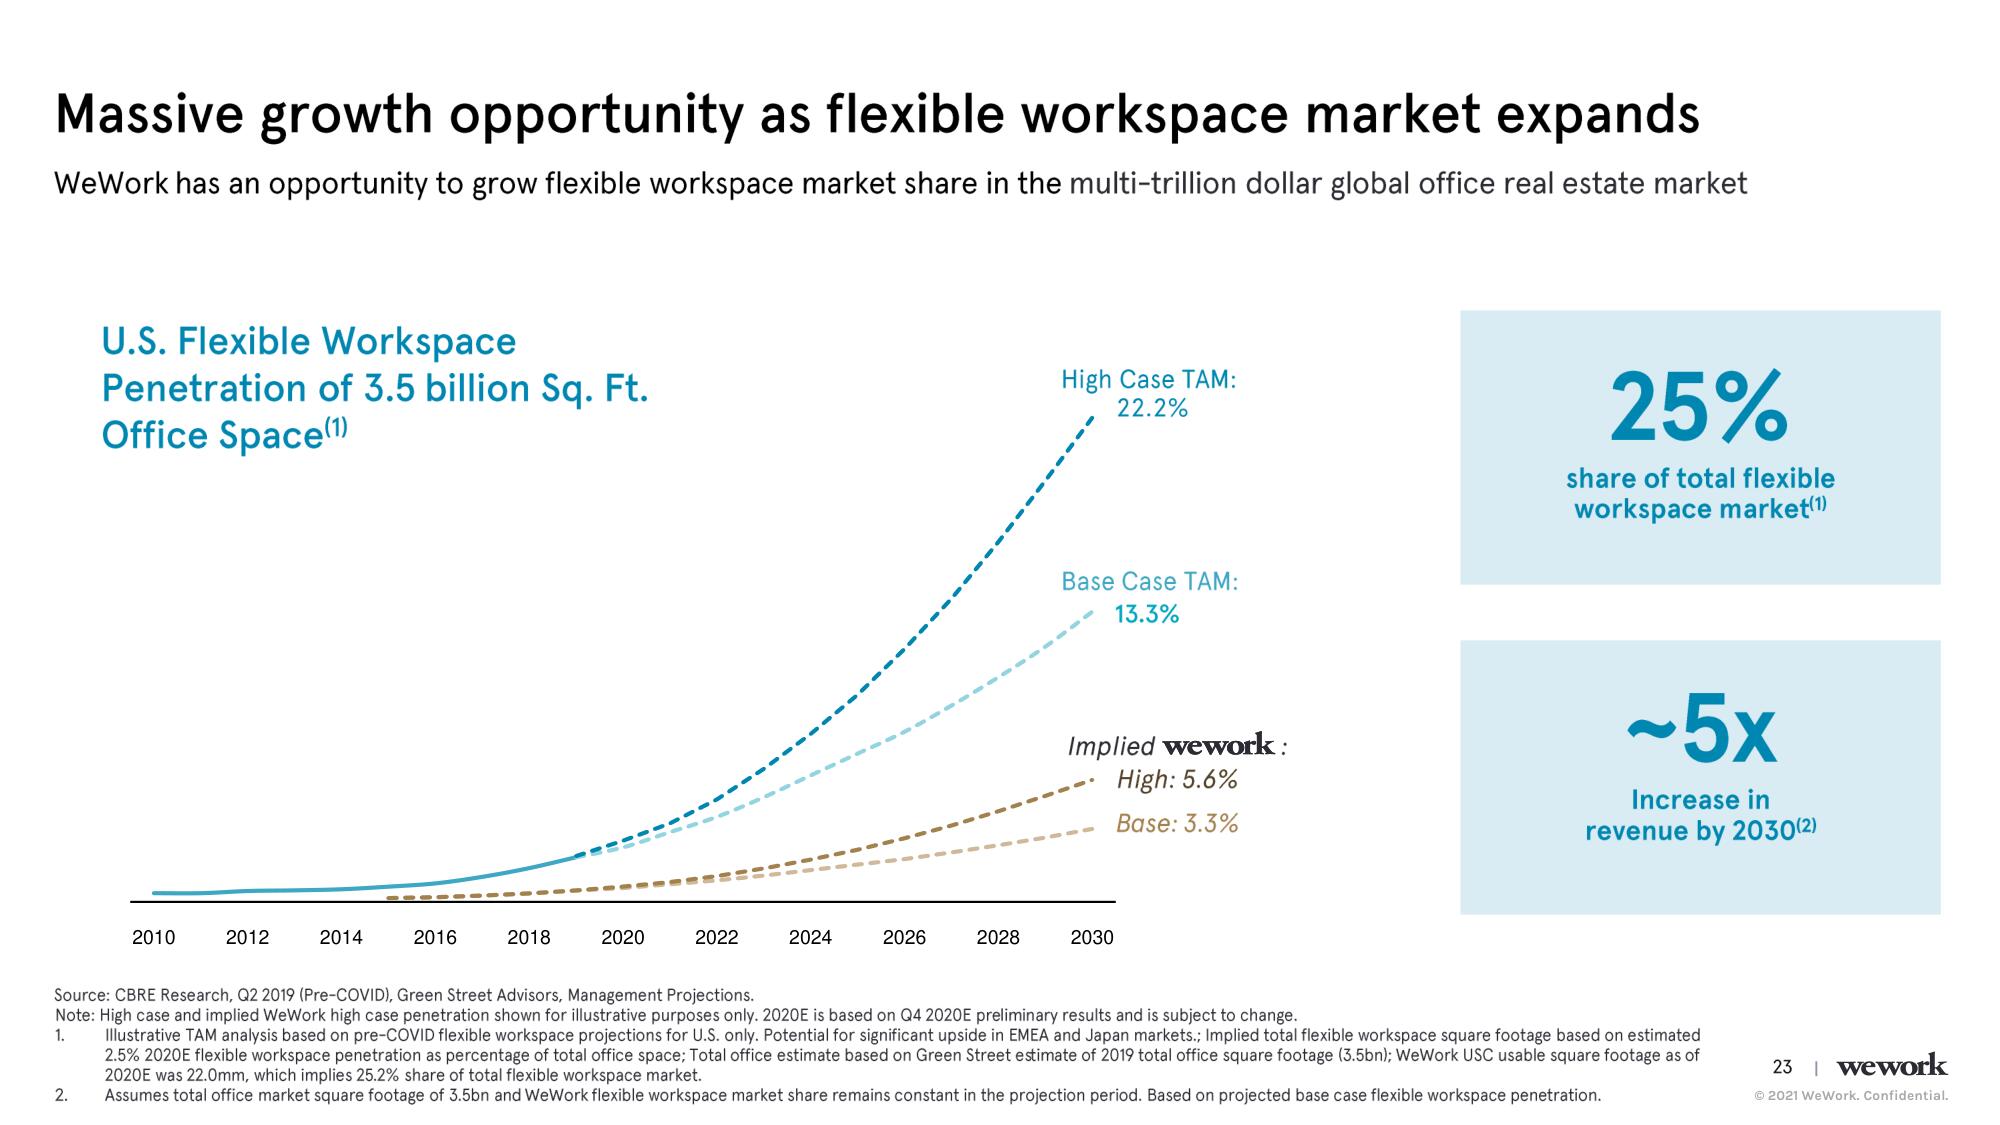
Massive growth opportunity as flexible workspace market expands
WeWork has an opportunity to grow flexible workspace market share in the multi-trillion dollar global office real estate market
U.S. Flexible Workspace
Penetration of 3.5 billion Sq. Ft.
Office Space(1)
2.
2010
2012
2014
2016
2018
2020
2022
2024
2026
2028
High Case TAM:
22.2%
Base Case TAM:
13.3%
Implied wework:
High: 5.6%
Base: 3.3%
2030
25%
share of total flexible
workspace market(1)
~5x
Increase in
revenue by 2030(2)
Source: CBRE Research, Q2 2019 (Pre-COVID), Green Street Advisors, Management Projections.
Note: High case and implied WeWork high case penetration shown for illustrative purposes only. 2020E is based on Q4 2020E preliminary results and is subject to change.
1.
Illustrative TAM analysis based on pre-COVID flexible workspace projections for U.S. only. Potential for significant upside in EMEA and Japan markets.; Implied total flexible workspace square footage based on estimated
2.5% 2020E flexible workspace penetration as percentage of total office space; Total office estimate based on Green Street estimate of 2019 total office square footage (3.5bn); WeWork USC usable square footage as of
2020E was 22.0mm, which implies 25.2% share of total flexible workspace market.
Assumes total office market square footage of 3.5bn and WeWork flexible workspace market share remains constant in the projection period. Based on projected base case flexible workspace penetration.
23 | wework
Ⓒ2021 WeWork. Confidential.View entire presentation