Uber Results Presentation Deck
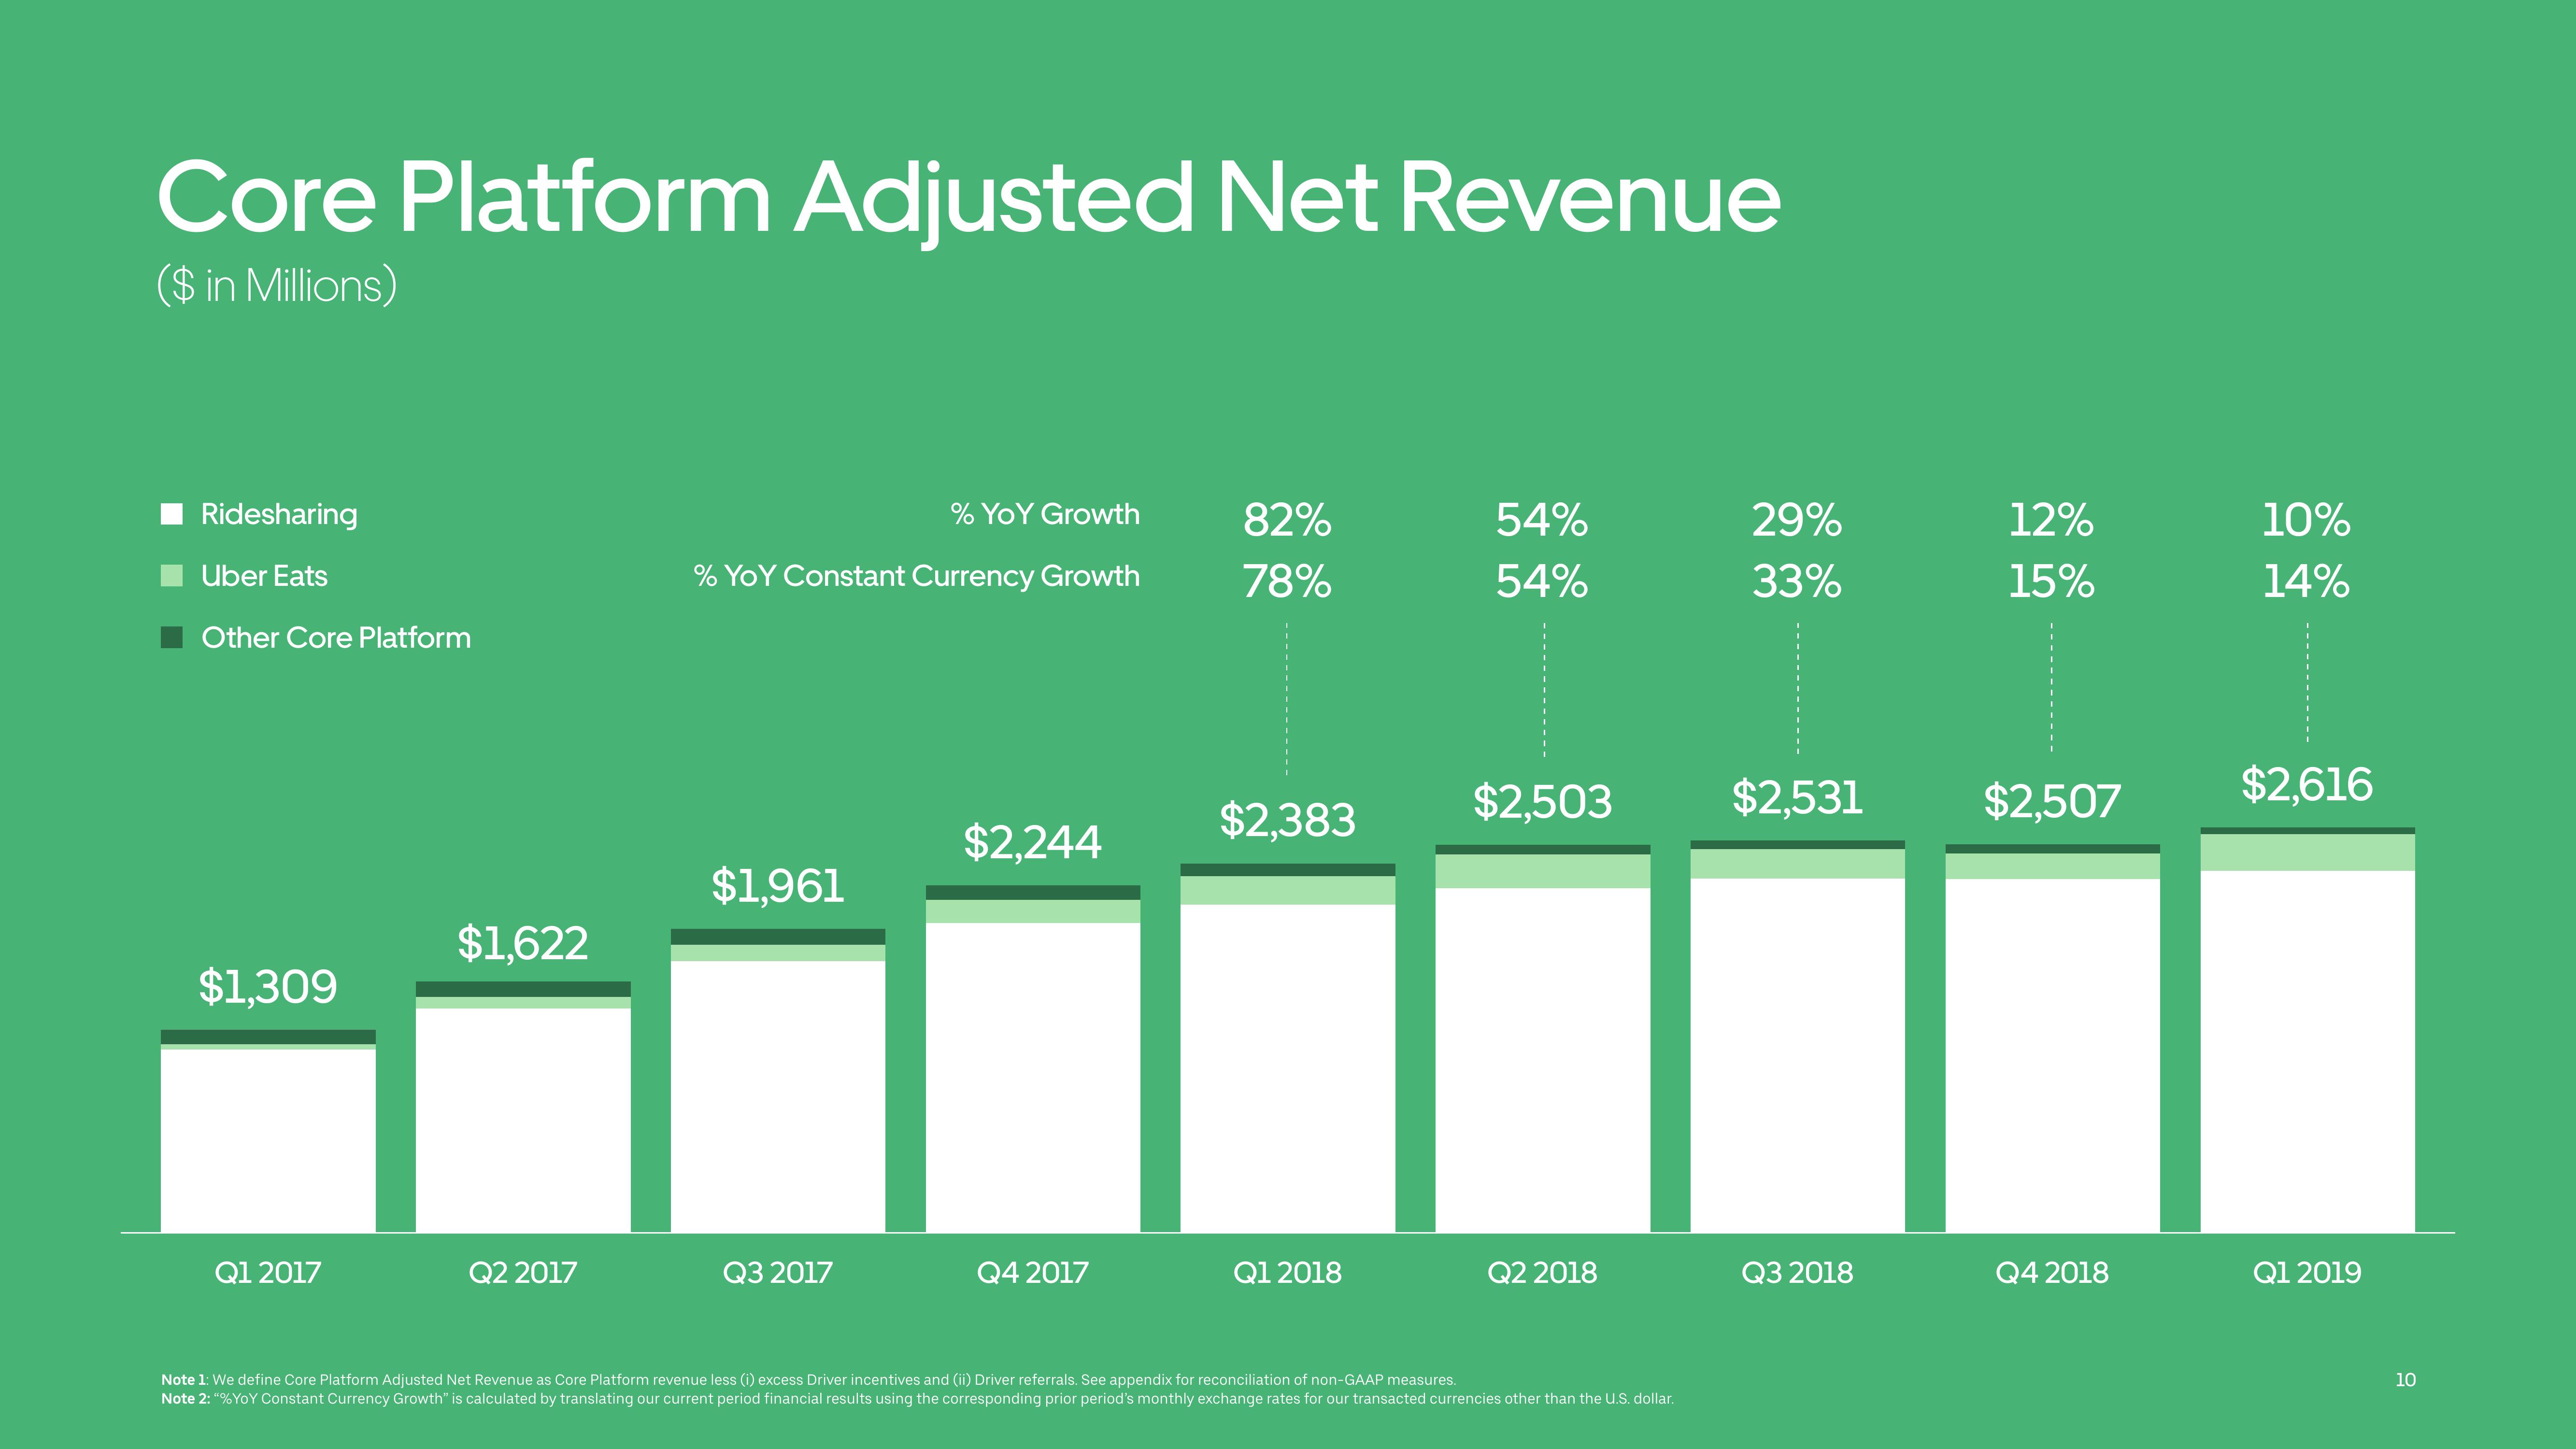
Core Platform Adjusted Net Revenue
($ in Millions)
Ridesharing
Uber Eats
Other Core Platform
$1,309
Q1 2017
$1,622
Q2 2017
% YoY Growth
% YoY Constant Currency Growth
$1,961
Q3 2017
$2,244
Q4 2017
82%
78%
$2,383
Q1 2018
54%
54%
$2,503
Q2 2018
Note 1: We define Core Platform Adjusted Net Revenue as Core Platform revenue less (i) excess Driver incentives and (ii) Driver referrals. See appendix for reconciliation of non-GAAP measures.
Note 2: "%YoY Constant Currency Growth" is calculated by translating our current period financial results using the corresponding prior period's monthly exchange rates for our transacted currencies other than the U.S. dollar.
29%
33%
‒‒‒‒‒‒‒‒‒‒‒
$2,531
Q3 2018
12%
15%
$2,507
Q4 2018
10%
14%
$2,616
Q1 2019
10View entire presentation