Paycor Investor Presentation Deck
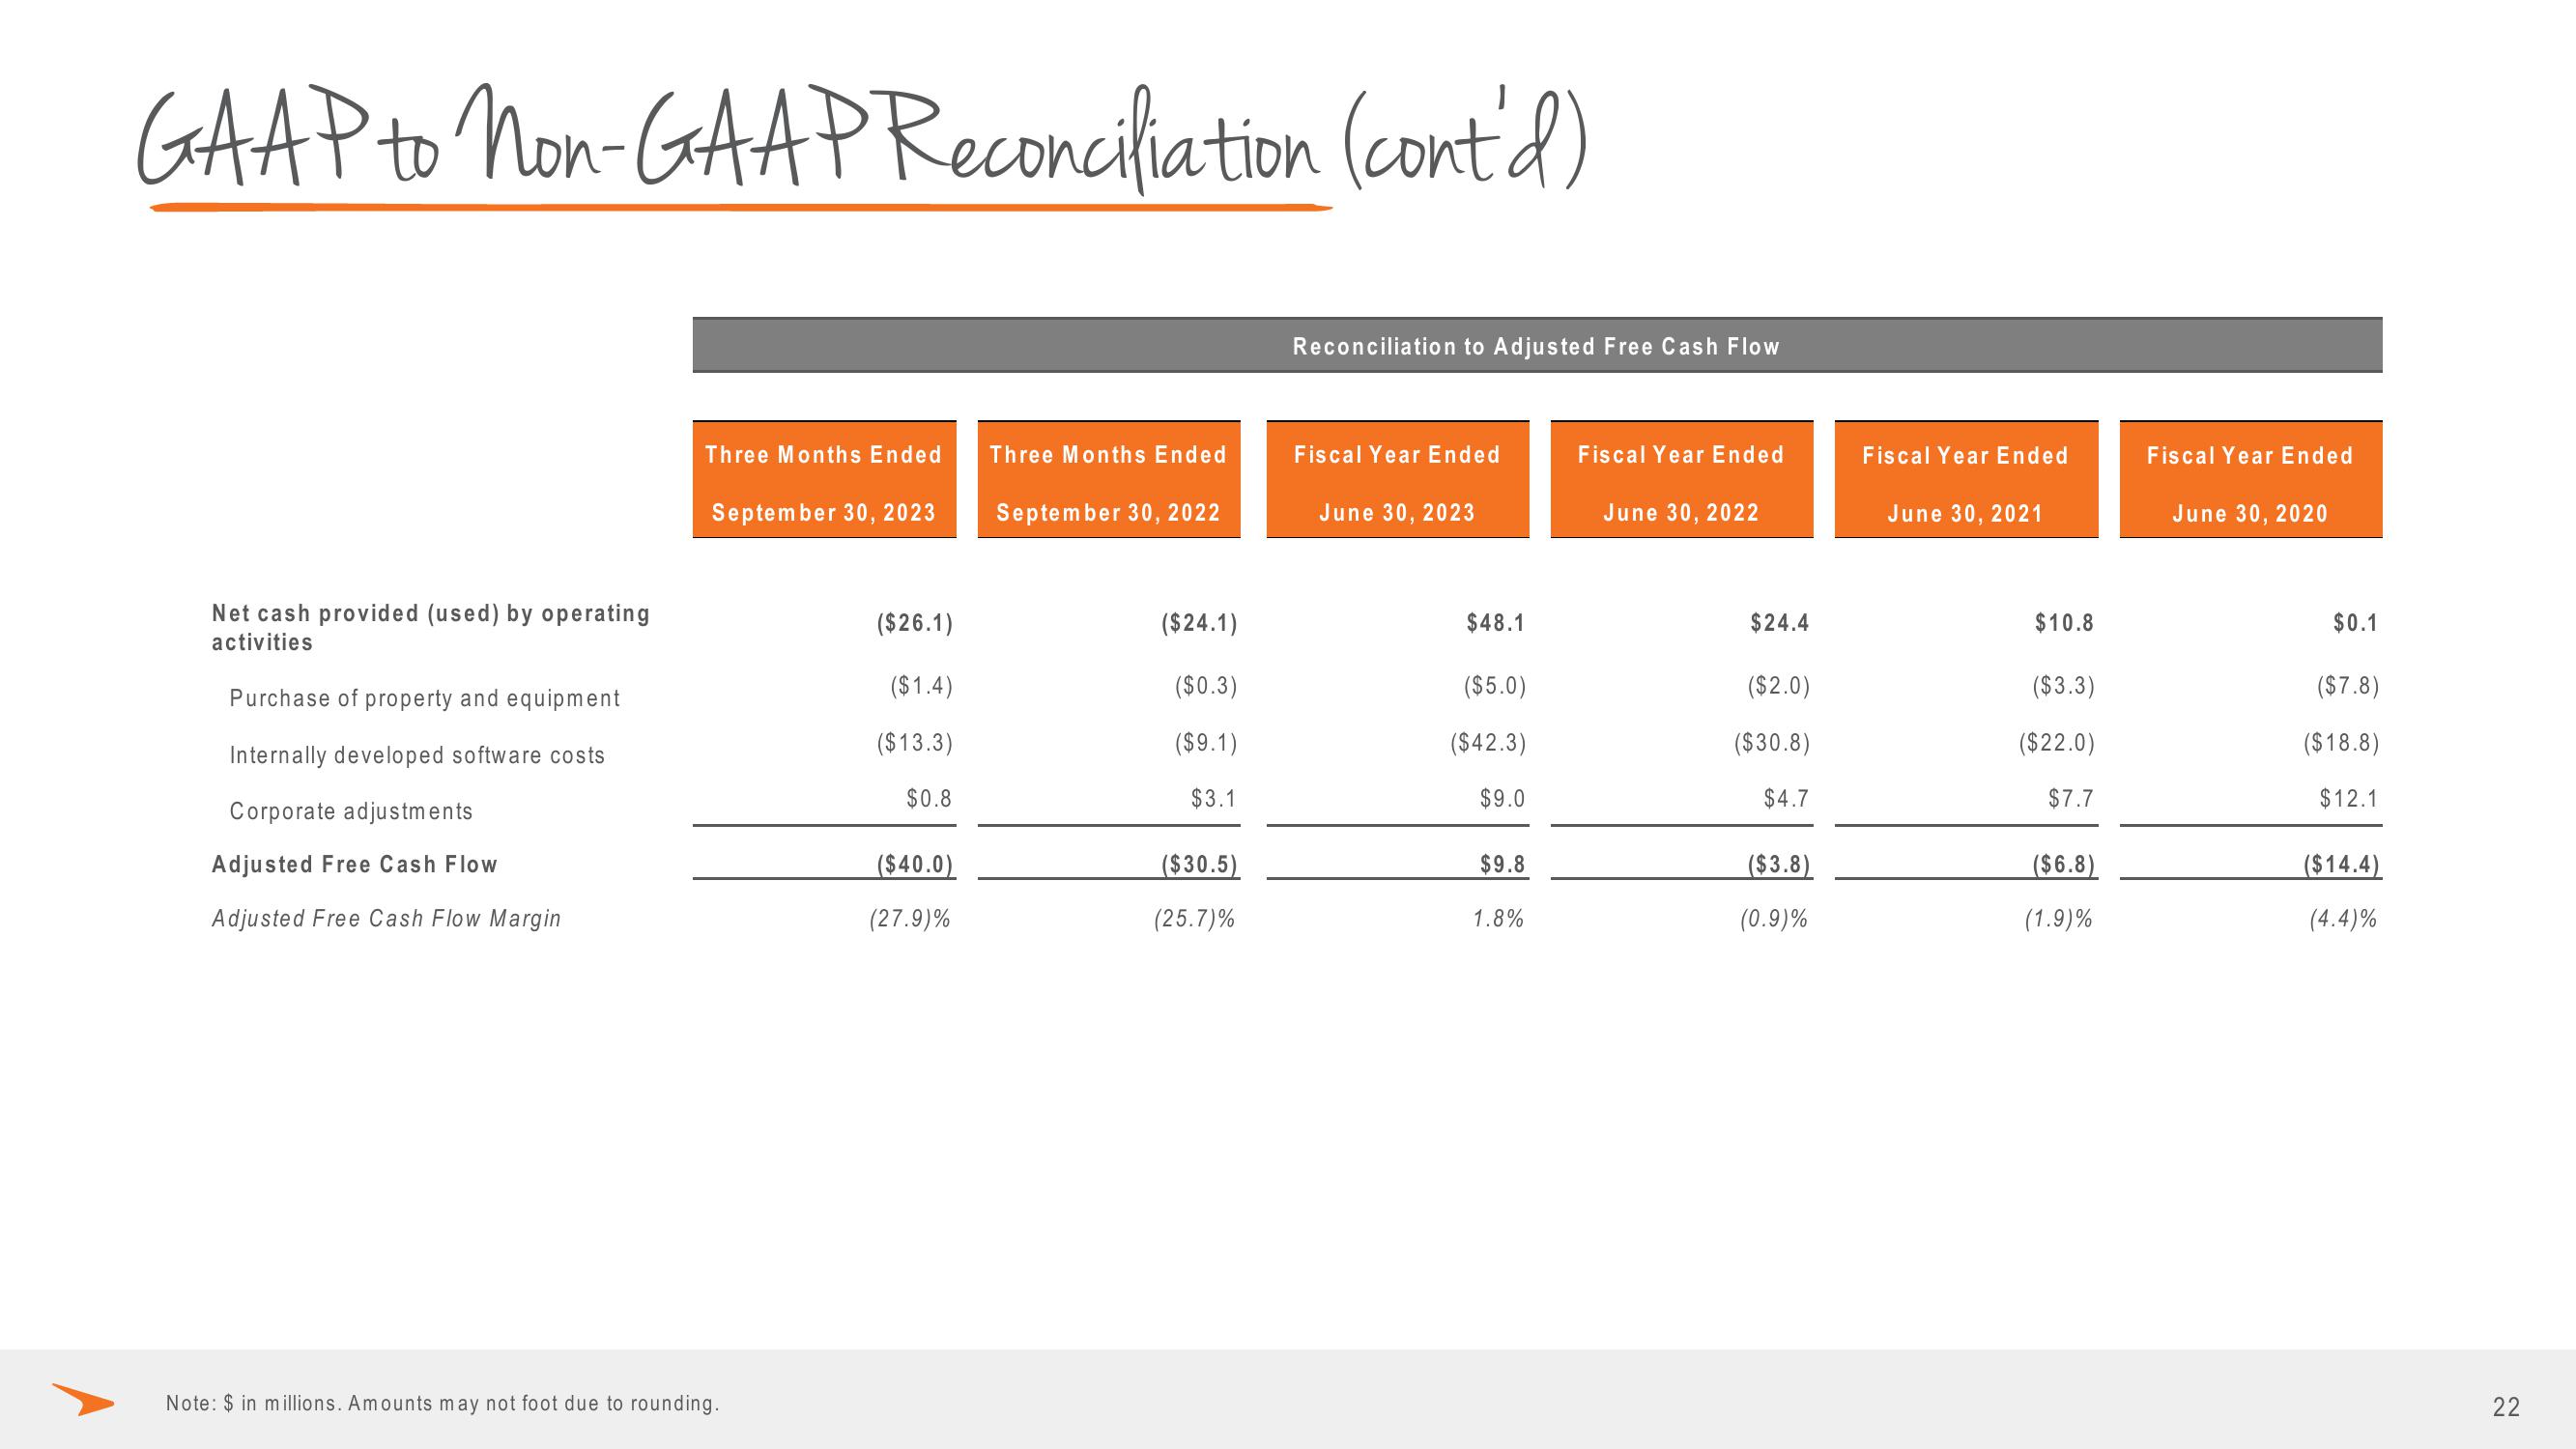
GAAP to non-GAAP Reconciliation (cont'd)
Net cash provided (used) by operating
activities
Purchase of property and equipment
Internally developed software costs
Corporate adjustments
Adjusted Free Cash Flow
Adjusted Free Cash Flow Margin
Three Months Ended
September 30, 2023
Note: $ in millions. Amounts may not foot due to rounding.
($26.1)
($1.4)
($13.3)
$0.8
($40.0)
(27.9)%
Three Months Ended
September 30, 2022
($24.1)
($0.3)
($9.1)
$3.1
($30.5)
(25.7)%
Reconciliation to Adjusted Free Cash Flow
Fiscal Year Ended
June 30, 2023
$48.1
($5.0)
($42.3)
$9.0
$9.8
1.8%
Fiscal Year Ended
June 30, 2022
$24.4
($2.0)
($30.8)
$4.7
($3.8)
(0.9)%
Fiscal Year Ended
June 30, 2021
$10.8
($3.3)
($22.0)
$7.7
($6.8)
(1.9)%
Fiscal Year Ended
June 30, 2020
$0.1
($7.8)
($18.8)
$12.1
($14.4)
(4.4)%
22View entire presentation