Snap Inc Investor Presentation Deck
Snap Inc.
Non-GAAP Financial Measures Reconciliation
(in thousands, unaudited)
Free Cash Flow Reconciliation
Net cash used in operating activities
Less:
Purchases of property and equipment
Free Cash Flow¹
Adjusted EBITDA Reconciliation
Net loss
Add (deduct):
Interest income
Interest expense
Other (income) expense, net
Income tax (benefit) expense
Depreciation and amortization
Stock-based compensation expense
Payroll tax expense related to stock-based compensation
Securities class actions legal charges
Lease exit charges
Reduction in force charges
Adjusted EBITDA²
$
$
$
$
2018
(689,924) $
(120,242)
(810,166) $
2018
(1,255,911) $
(27,228)
3,894
8,248
2,547
91,648
538,211
21,927
31,143
9,884
(575,637) $
2019
(304,958) $
(36,478)
(341,436) $
2019
(1,033,660) $
(36,042)
24,994
(59,013)
393
87,245
686,013
27,840
100,000
(202,230) $
2020
(167,644)
(57,832)
(225,476)
2020
(944,839)
(18,127)
97,228
(14,988)
18,654
86,744
770,182
50,309
45,163
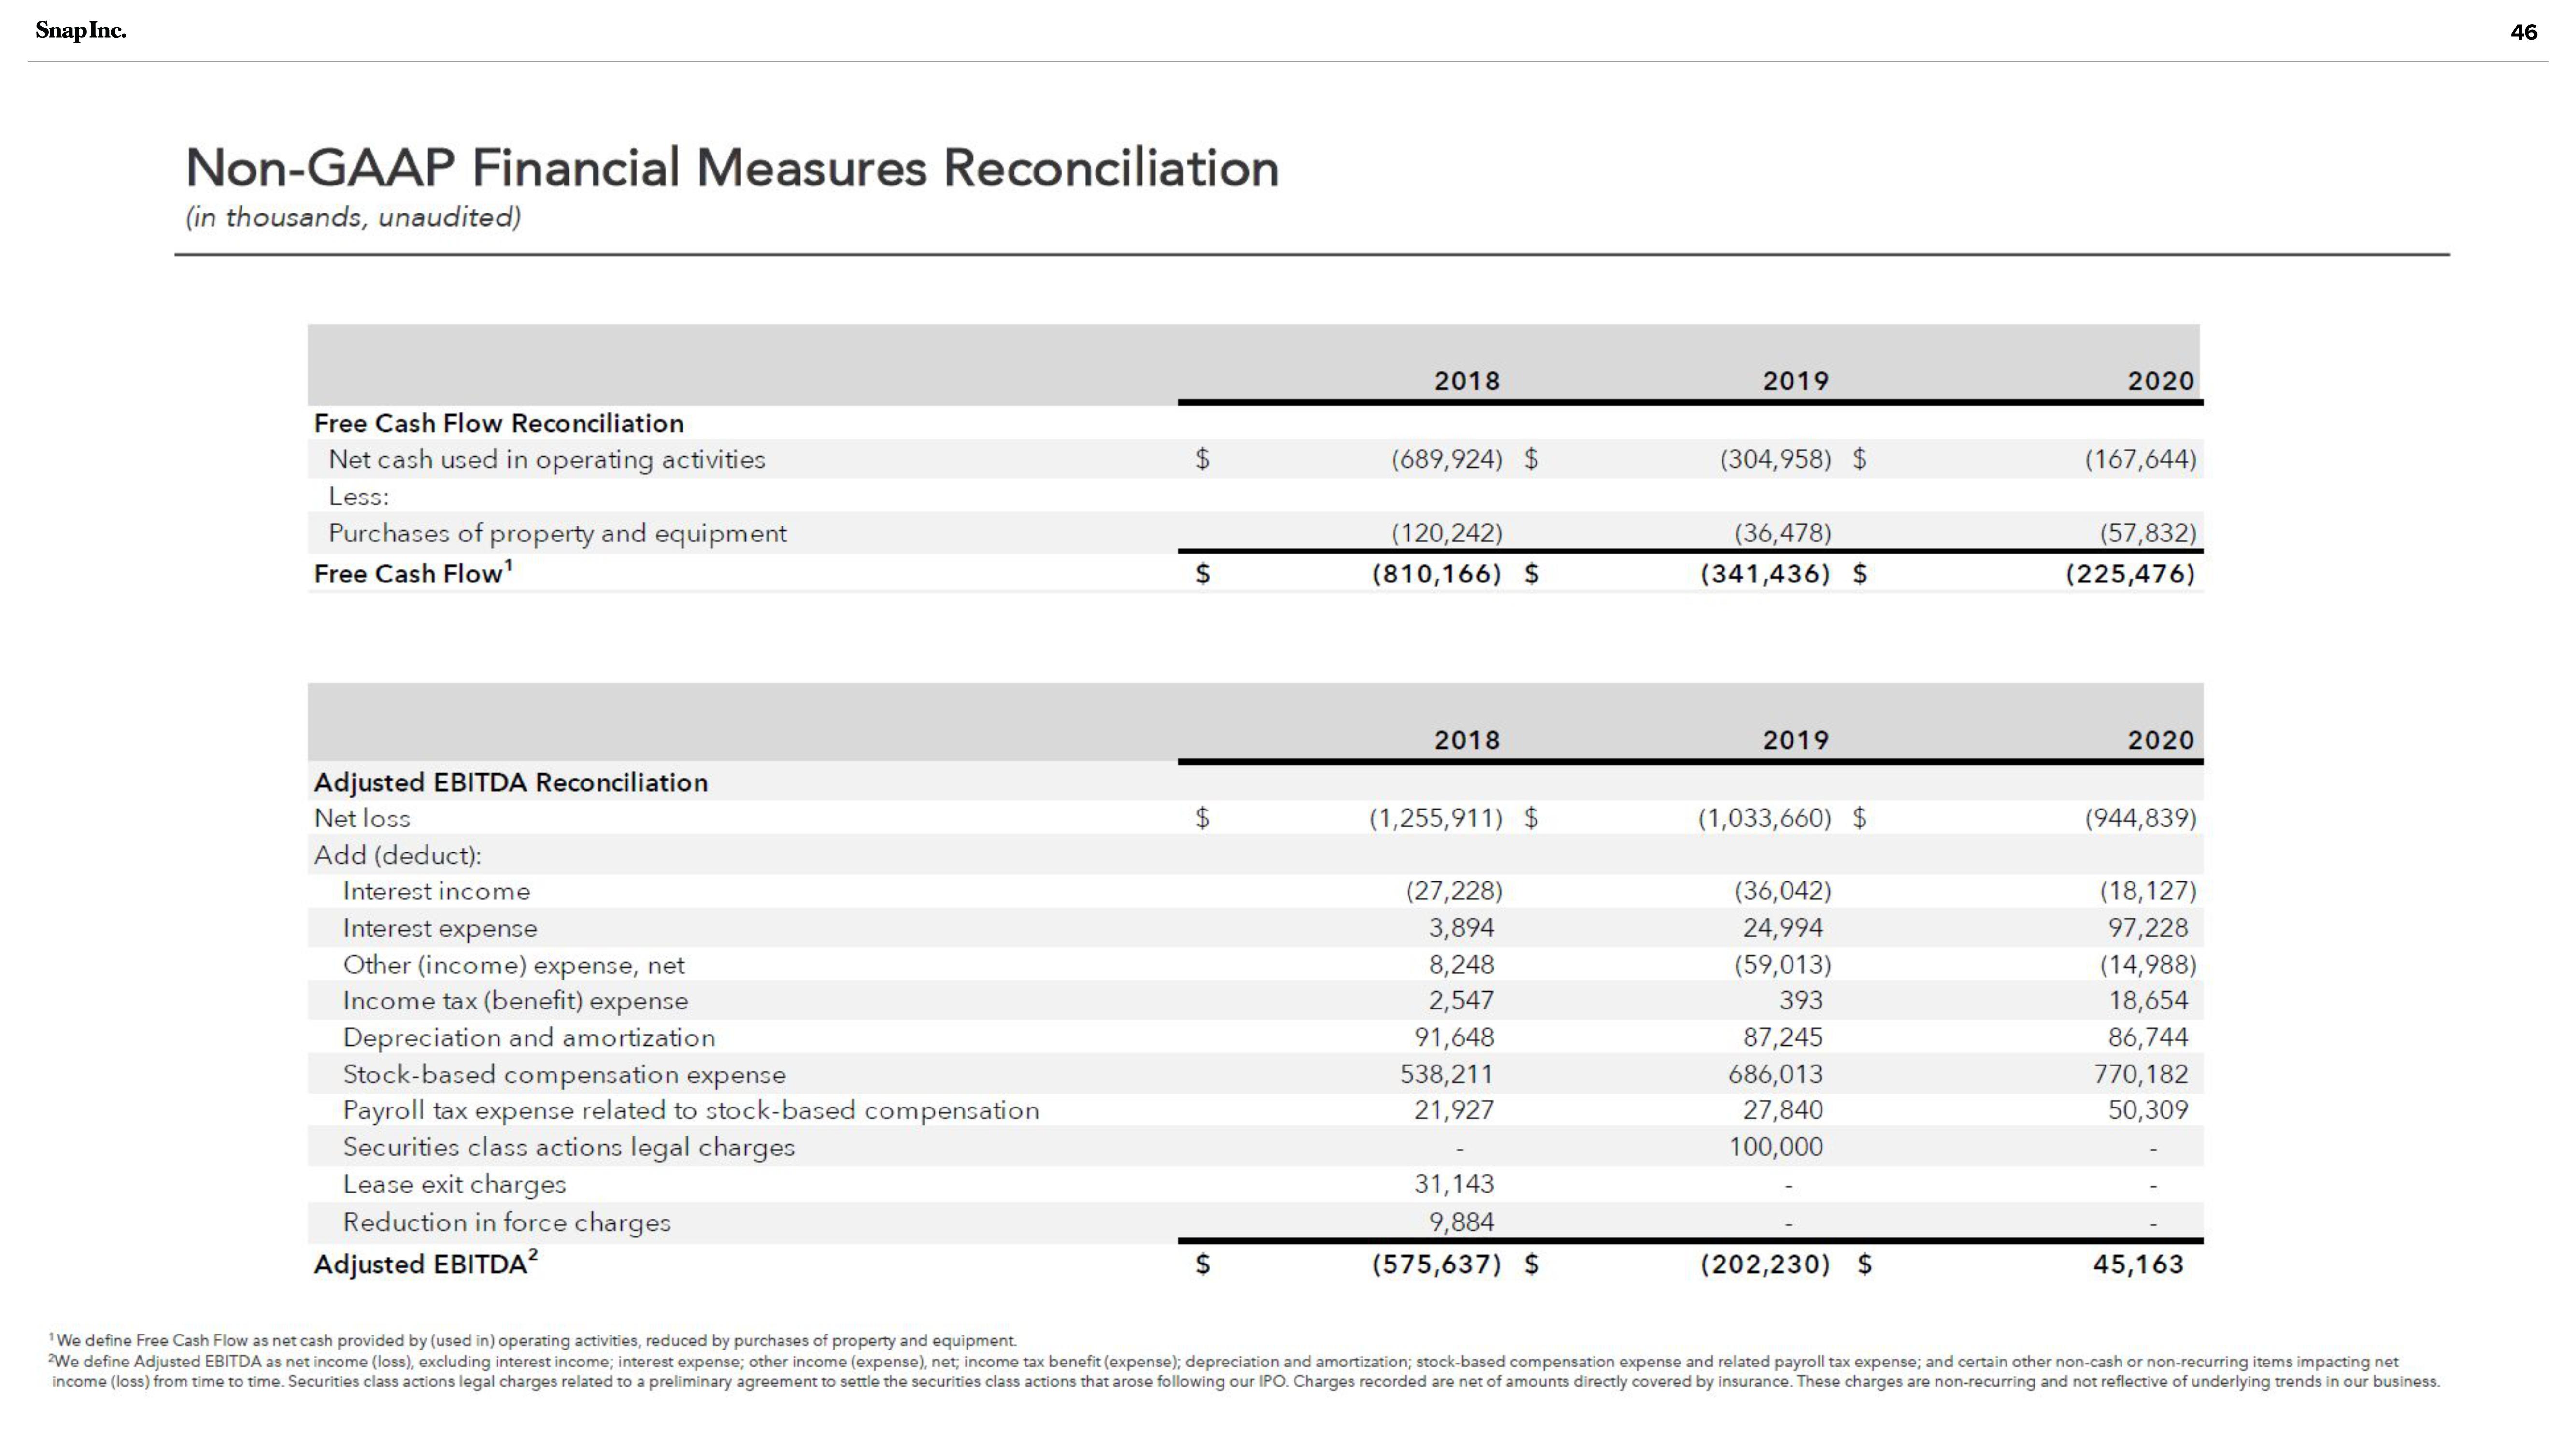
¹We define Free Cash Flow as net cash provided by (used in) operating activities, reduced by purchases of property and equipment.
We define Adjusted EBITDA as net income (loss), excluding interest income; interest expense; other income (expense), net; income tax benefit (expense); depreciation and amortization; stock-based compensation expense and related payroll tax expense; and certain other non-cash or non-recurring items impacting net
income (loss) from time to time. Securities class actions legal charges related to a preliminary agreement to settle the securities class actions that arose following our IPO. Charges recorded are net of amounts directly covered by insurance. These charges are non-recurring and not reflective of underlying trends in our business.
46View entire presentation