AT&T Results Presentation Deck
6
2Q22 Financial Summary
Continuing Operations, $ in billions, except EPS
Revenues
Standalone AT&T*
U.S. Video and other
$35.7
$6.7
$29.0
$29.6
2Q21 2Q22
Continuing Operations EPS
Adjustments:
Adjusted EPS+5
Standalone AT&T*
U.S. Video and other
Comparable Adj. Ol Margin¹1,2
$0.73
$0.09 $0.65
$0.64
Continuing Operations Adjusted EPS
Less: U.S. Video and other dispositions
Standalone AT&T* Adjusted EPS
19.7%
19.9%
2Q21 2Q22
DIRECTV intangible amortization (proportionate share)
Actuarial loss/(gain) on benefit plans
Non-cash restructuring and impairments
Other adjustments
2Q21
$0.76
$0.02
Cash from Ops
Free Cash Flow+3
($0.05)
$0.73
($0.09)
$0.64
$10.2
$5.2
$7.7
$1.4
2Q21 2Q22
2Q22
$0.59
$0.04
($0.13)
$0.06
$0.09
$0.65
$0.65
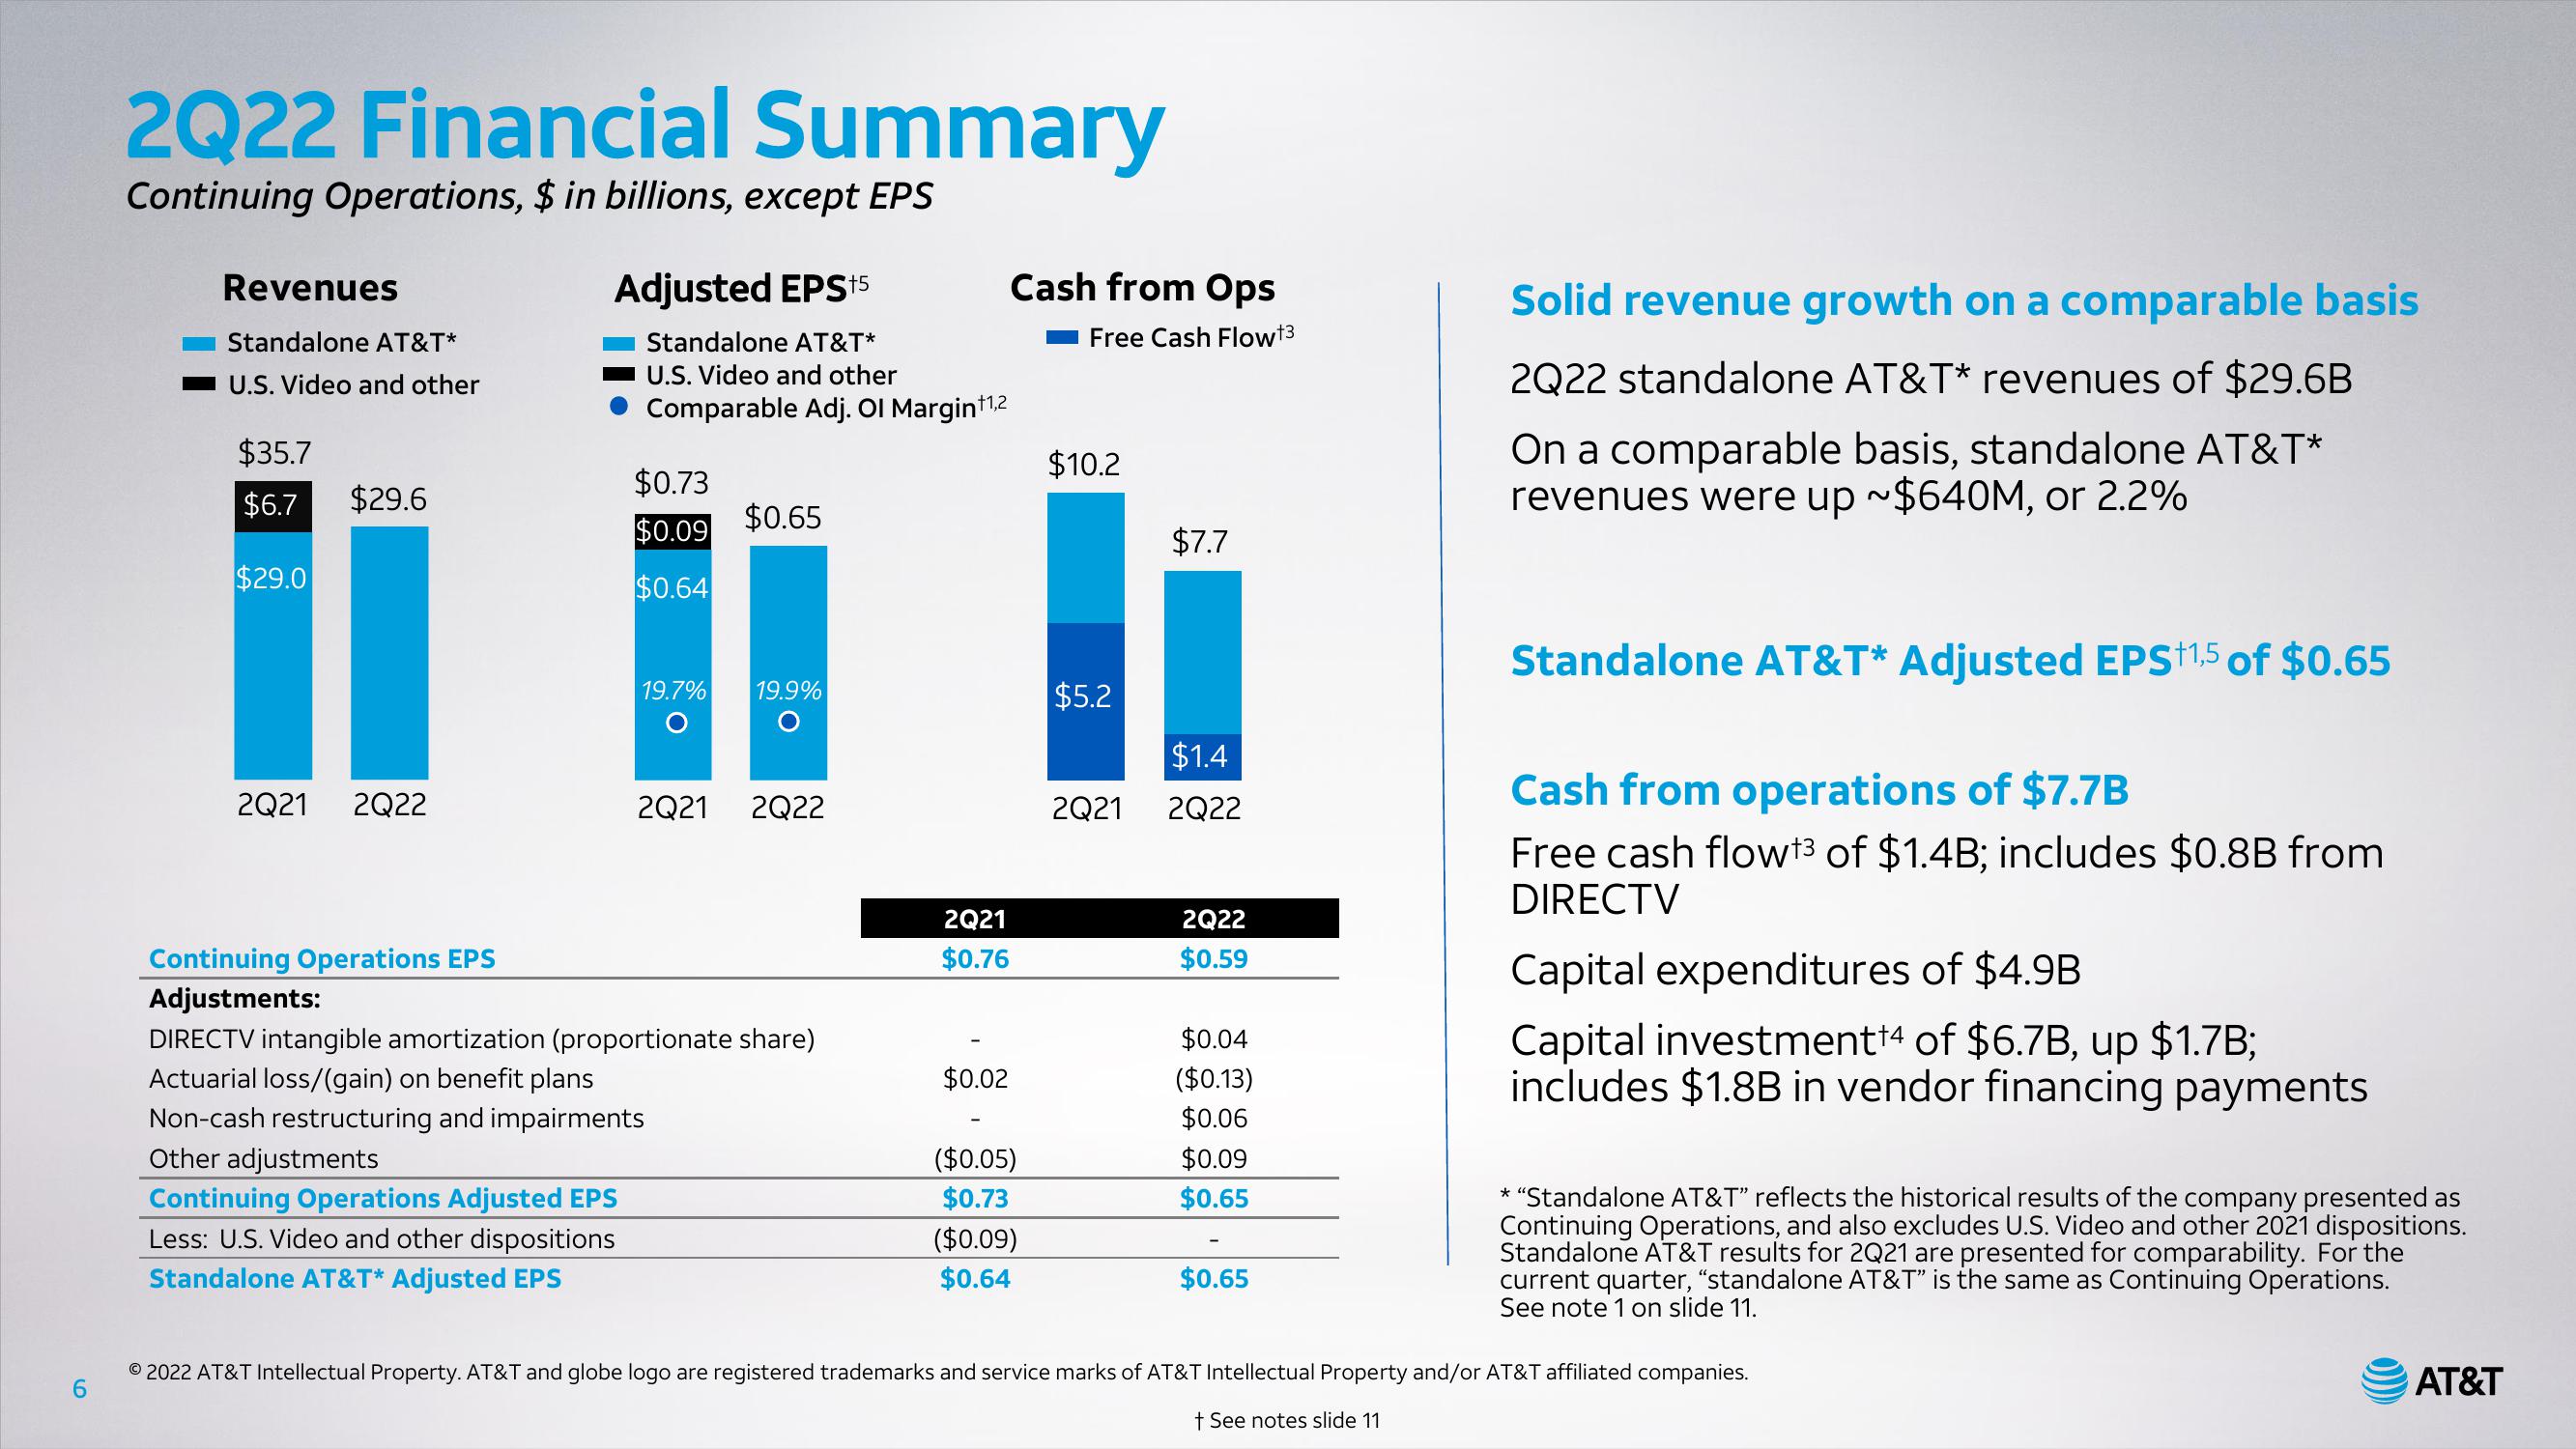
Solid revenue growth on a comparable basis
2Q22 standalone AT&T* revenues of $29.6B
On a comparable basis, standalone AT&T*
revenues were up ~$640M, or 2.2%
Standalone AT&T* Adjusted EPS +1,5 of $0.65
Cash from operations of $7.7B
Free cash flowt³ of $1.4B; includes $0.8B from
DIRECTV
Capital expenditures of $4.9B
Capital investment¹4 of $6.7B, up $1.7B;
includes $1.8B in vendor financing payments
* "Standalone AT&T" reflects the historical results of the company presented as
Continuing Operations, and also excludes U.S. Video and other 2021 dispositions.
Standalone AT&T results for 2Q21 are presented for comparability. For the
current quarter, "standalone AT&T" is the same as Continuing Operations.
See note 1 on slide 11.
© 2022 AT&T Intellectual Property. AT&T and globe logo are registered trademarks and service marks of AT&T Intellectual Property and/or AT&T affiliated companies.
+ See notes slide 11
AT&TView entire presentation