Vivid Seats SPAC Presentation Deck
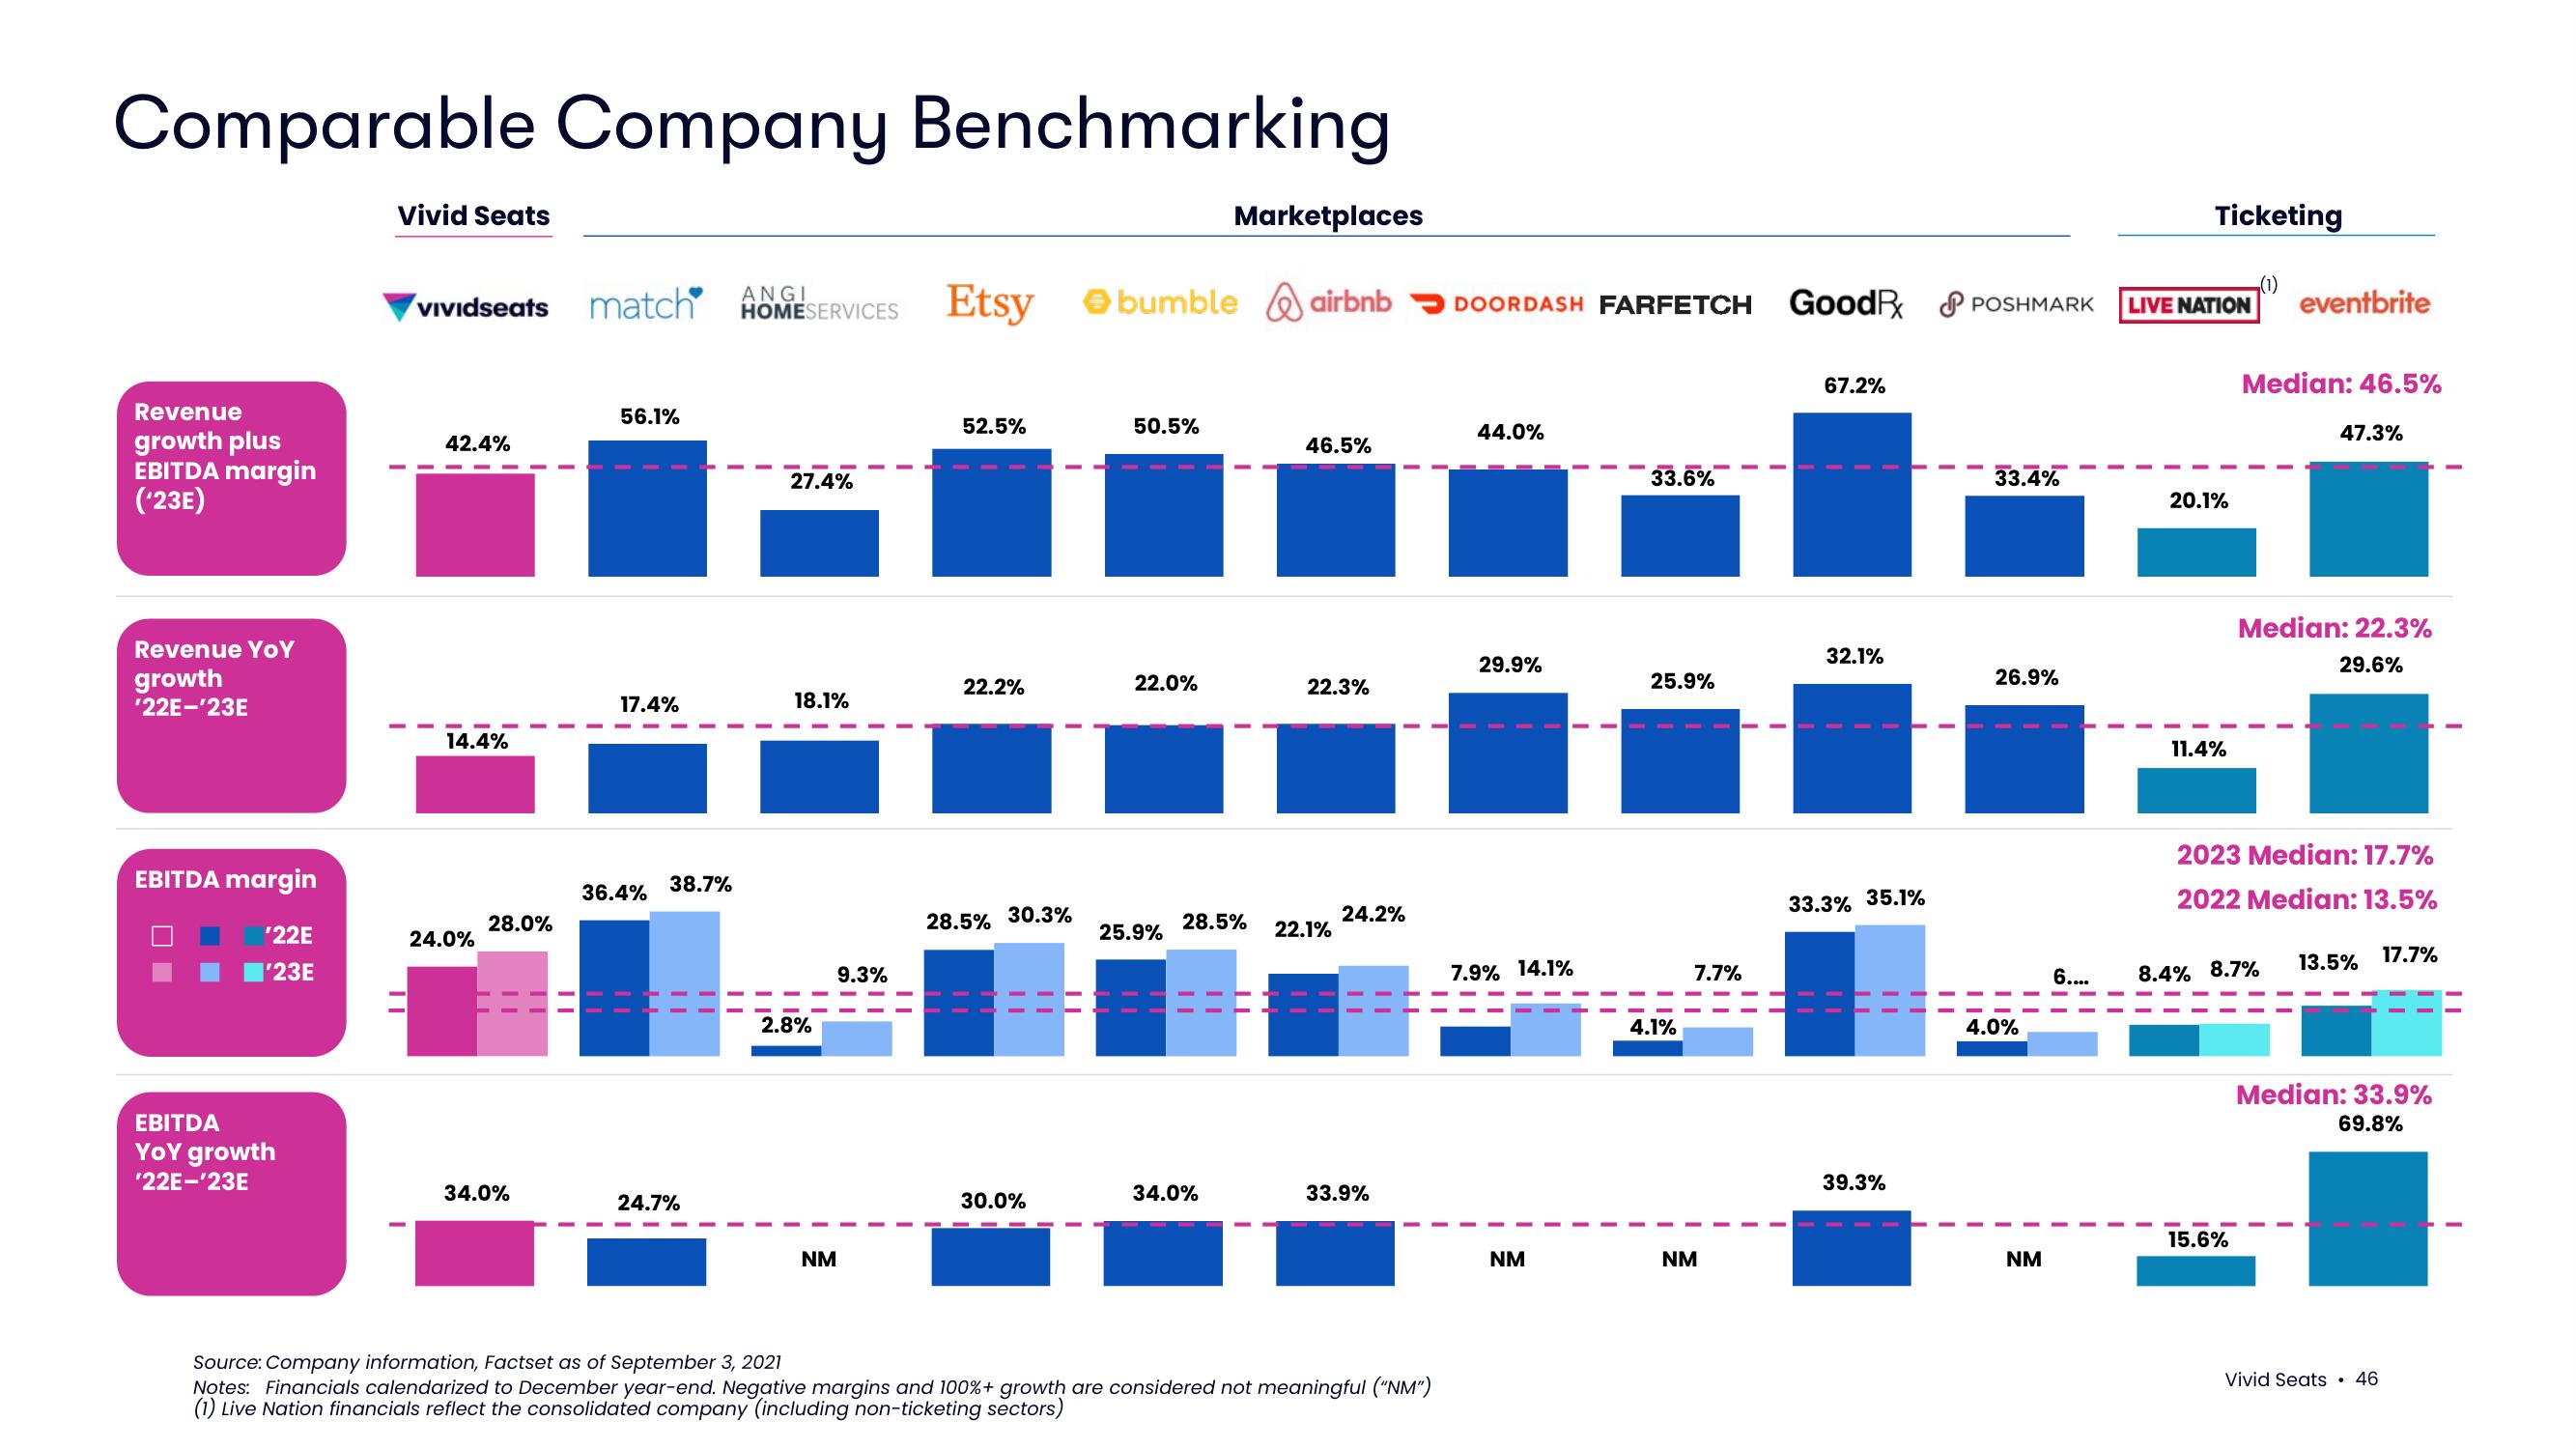
Comparable Company Benchmarking
Revenue
growth plus
EBITDA margin
('23E)
Revenue YoY
growth
'22E-'23E
EBITDA margin
'22E
I'23E
EBITDA
YoY growth
'22E-'23E
Vivid Seats
II
Vividseats match
42.4%
14.4%
24.0%
28.0%
34.0%
56.1%
17.4%
36.4%
38.7%
24.7%
ANGI
HOMESERVICES
27.4%
18.1%
2.8%
NM
9.3%
11
Etsy
52.5%
22.2%
28.5%
30.3%
30.0%
bumble airbnb DOORDASH FARFETCH GoodR POSHMARK
50.5%
22.0%
25.9%
Marketplaces
28.5%
34.0%
46.5%
22.3%
22.1%
24.2%
33.9%
Source: Company information, Factset as of September 3, 2021
Notes: Financials calendarized to December year-end. Negative margins and 100% + growth are considered not meaningful ("NM")
(1) Live Nation financials reflect the consolidated company (including non-ticketing sectors)
44.0%
29.9%
7.9% 14.1%
NM
33.6%
25.9%
4.1%
7.7%
NM
67.2%
32.1%
33.3% 35.1%
39.3%
33.4%
26.9%
4.0%
NM
6....
Ticketing
LIVE NATION eventbrite
20.1%
11.4%
Median: 46.5%
15.6%
47.3%
Median: 22.3%
29.6%
2023 Median: 17.7%
2022 Median: 13.5%
8.4% 8.7%
13.5% 17.7%
Median: 33.9%
69.8%
Vivid Seats 46View entire presentation