Q2 FY24 Earnings Presentation slide image

Q2 FY24 Earnings Presentation

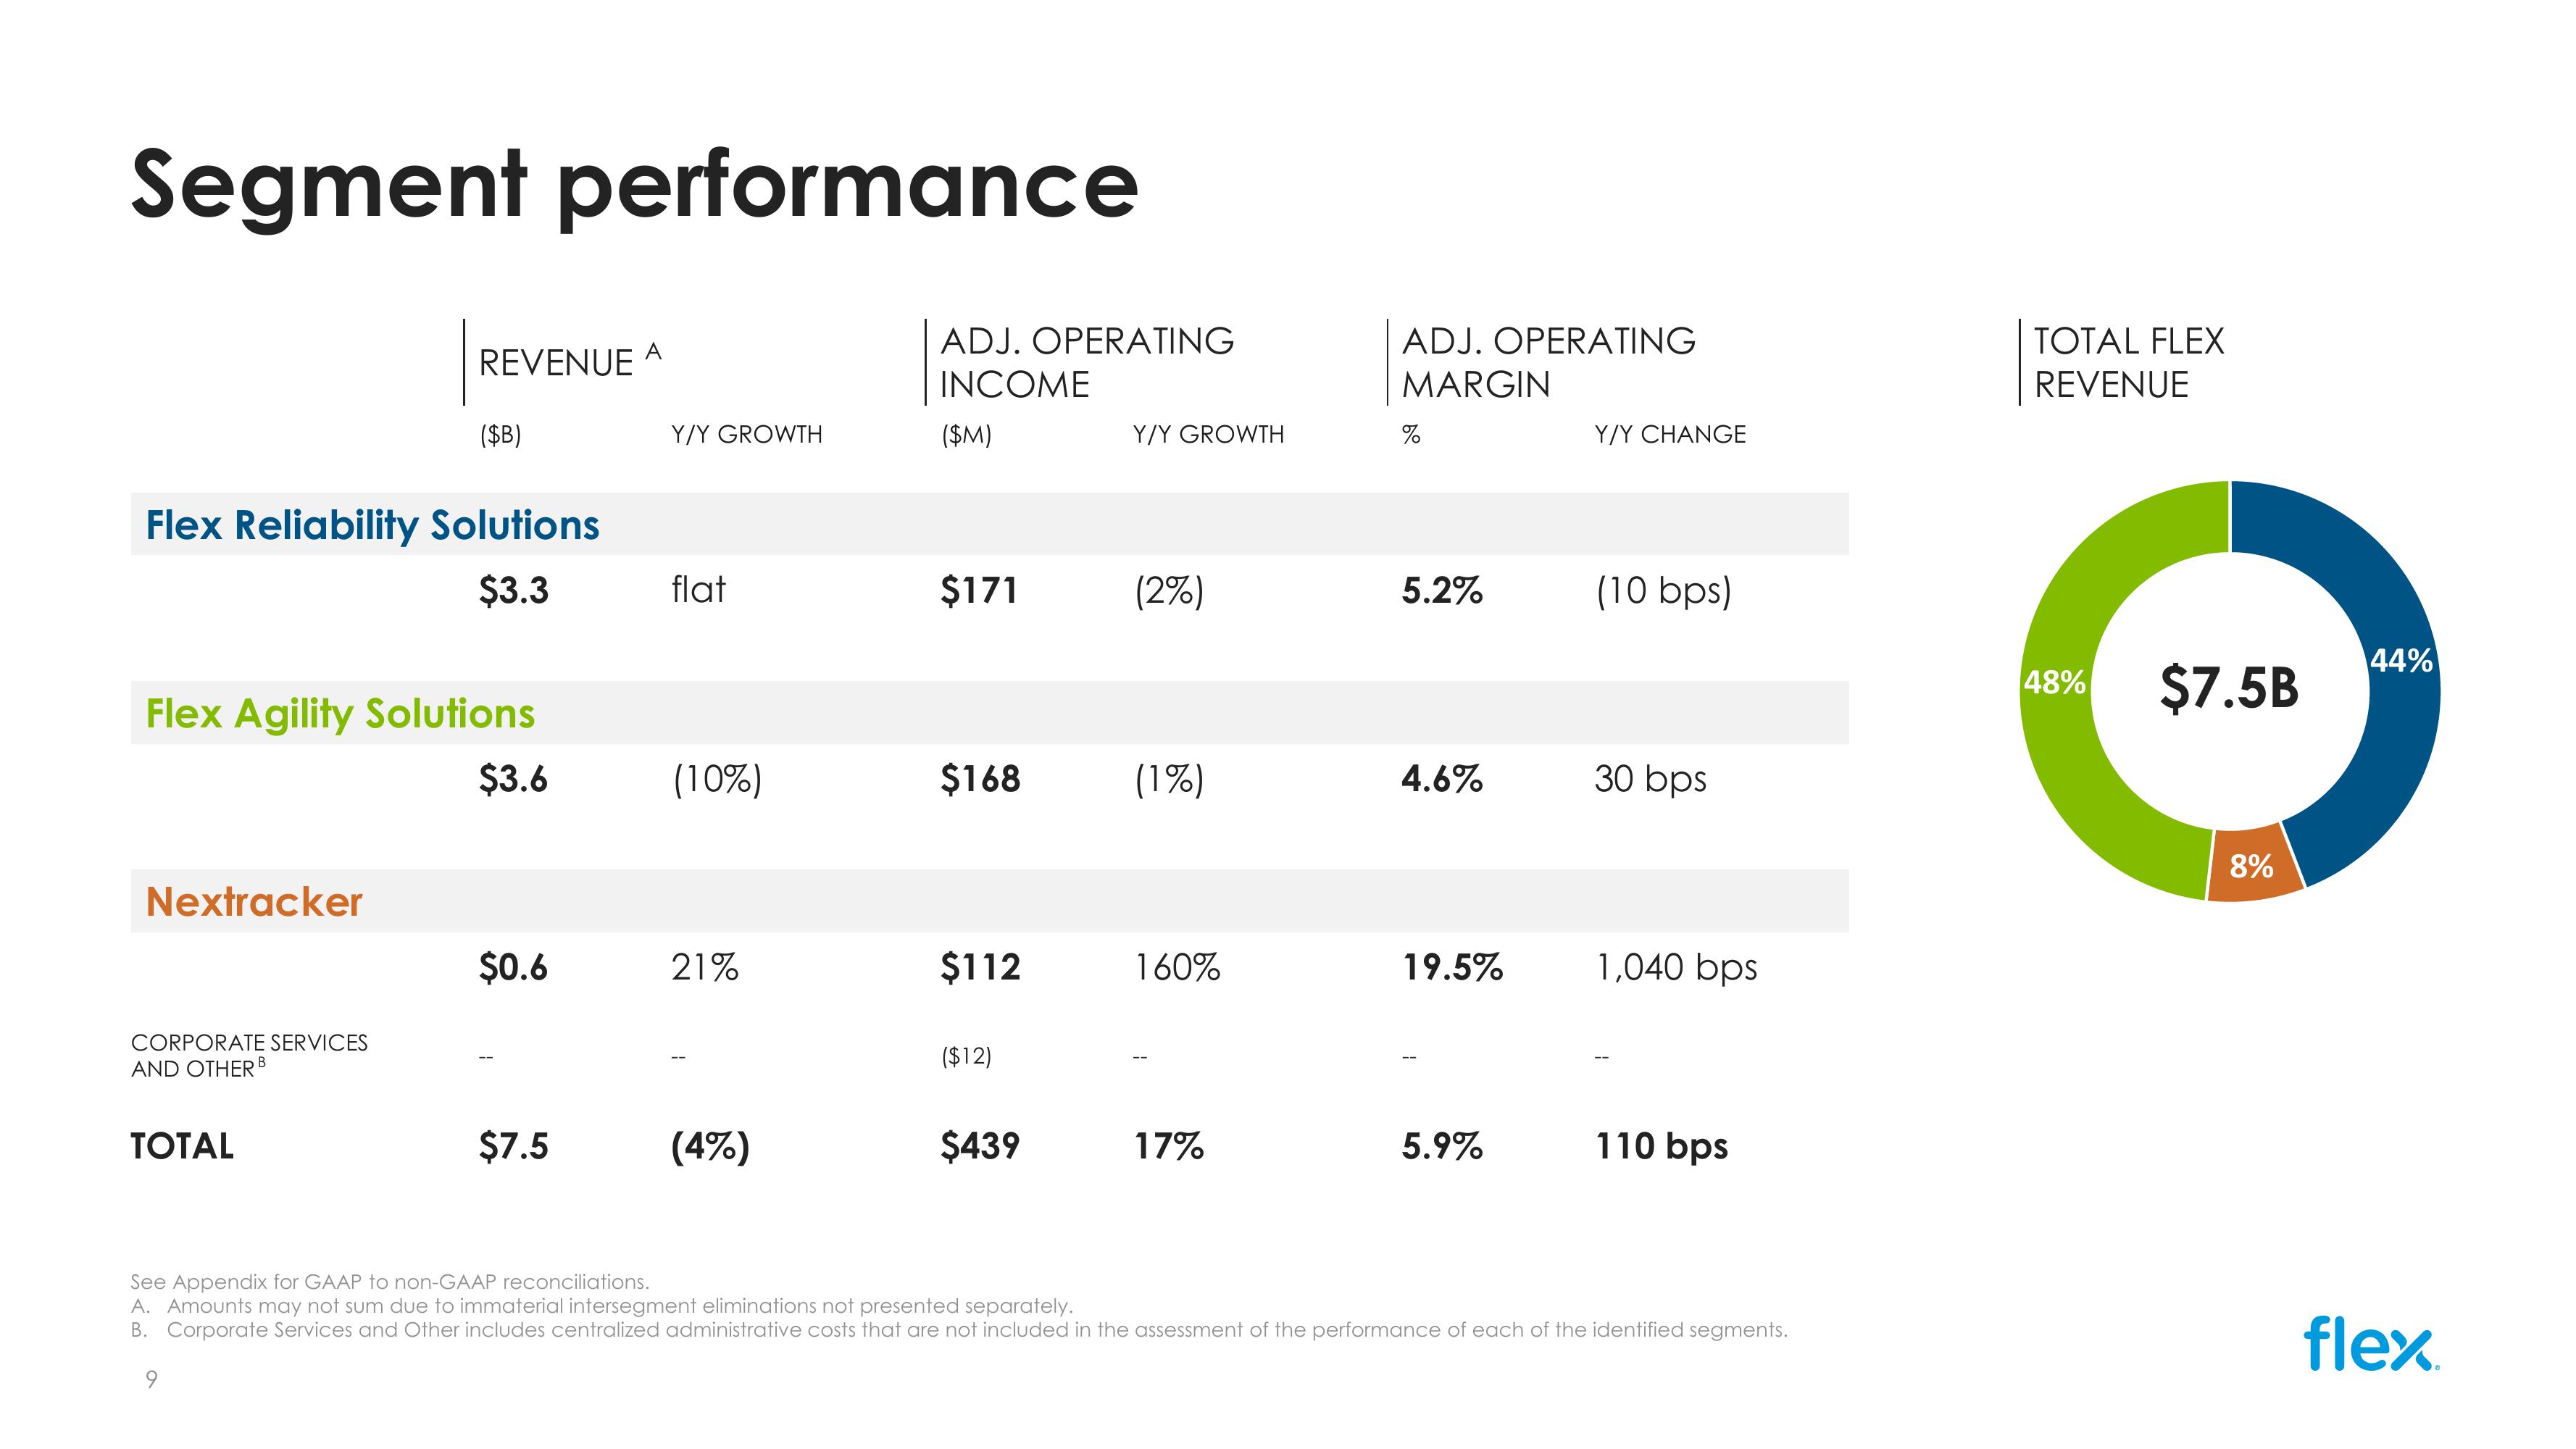
Segment performance REVENUE A ($B) Flex Reliability Solutions ADJ. OPERATING INCOME Y/Y GROWTH ($M) ADJ. OPERATING MARGIN Y/Y CHANGE Y/Y GROWTH % TOTAL FLEX REVENUE $3.3 flat $171 (2%) 5.2% (10 bps) 44% 48% $7.5B $3.6 (10%) $168 (1%) 4.6% 30 bps Flex Agility Solutions Nextracker CORPORATE SERVICES AND OTHER B TOTAL $0.6 21% $112 160% 19.5% 1,040 bps ($12) $7.5 (4%) $439 17% 5.9% 110 bps 8% See Appendix for GAAP to non-GAAP reconciliations. A. Amounts may not sum due to immaterial intersegment eliminations not presented separately. B. Corporate Services and Other includes centralized administrative costs that are not included in the assessment of the performance of each of the identified segments. 9 flex
View entire presentation