Silicon Valley Bank Results Presentation Deck
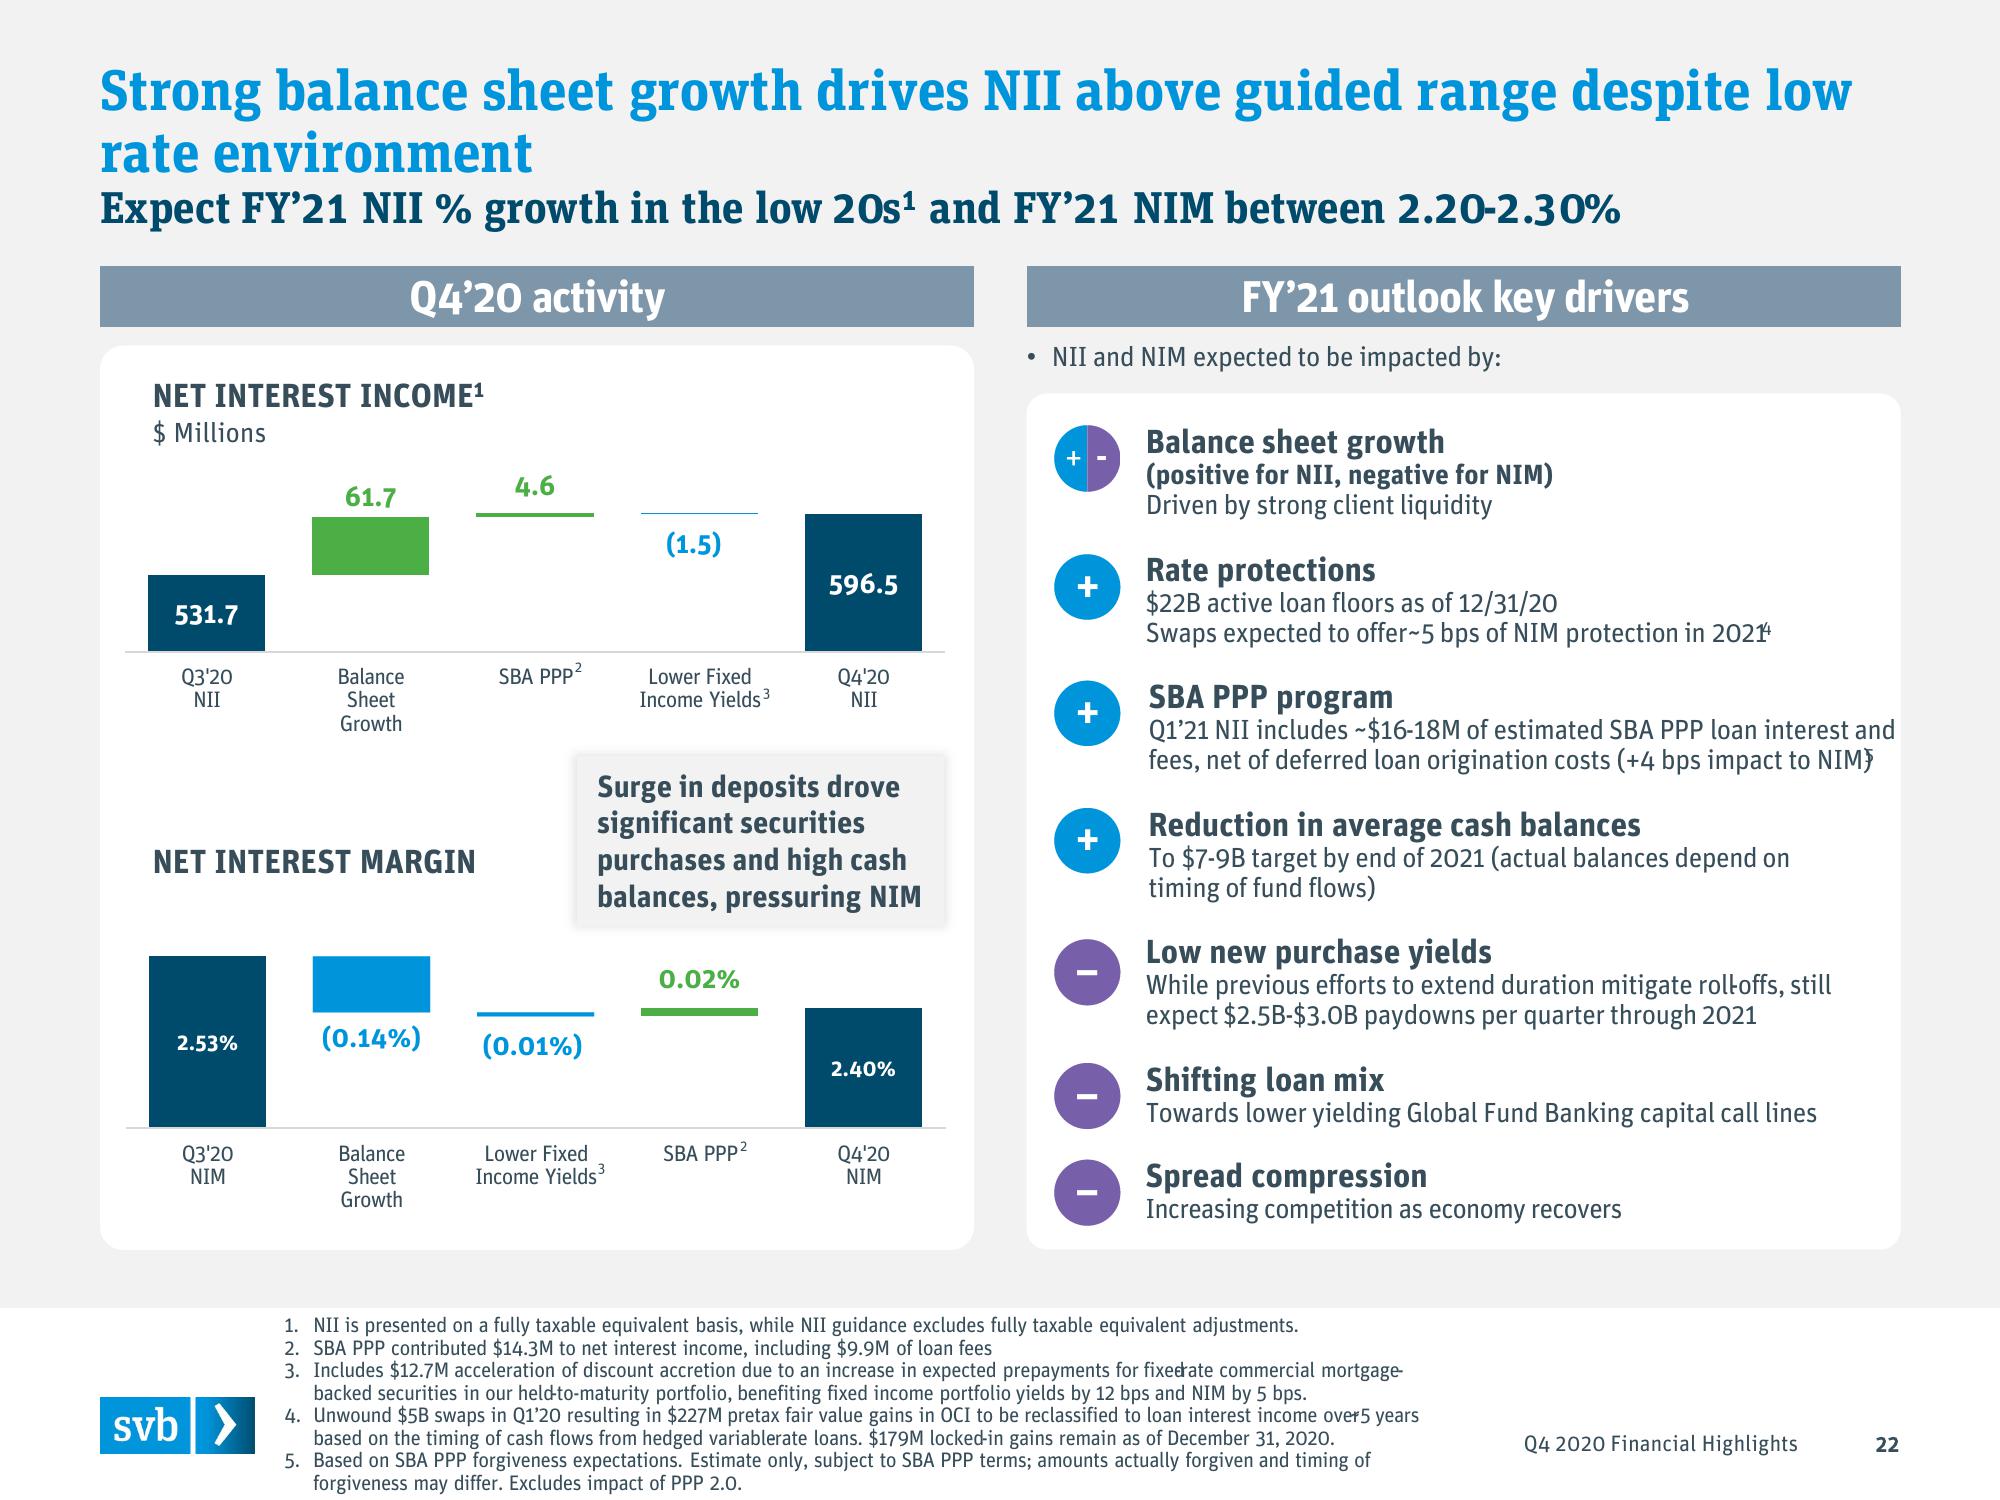
Strong balance sheet growth drives NII above guided range despite low
rate environment
Expect FY'21 NII % growth in the low 20s¹ and FY'21 NIM between 2.20-2.30%
Q4'20 activity
NET INTEREST INCOME¹
$ Millions
531.7
Q3'20
NII
2.53%
NET INTEREST MARGIN
Q3'20
NIM
61.7
svb>
Balance
Sheet
Growth
(0.14%)
Balance
Sheet
Growth
4.6
SBA PPP²
(0.01%)
(1.5)
Lower Fixed
Income Yields³
Lower Fixed
Income Yields 3
Surge in deposits drove
significant securities
purchases and high cash
balances, pressuring NIM
0.02%
596.5
SBA PPP²
Q4'20
NII
2.40%
Q4'20
NIM
• NII and NIM expected to be impacted by:
+
+
+
FY'21 outlook key drivers
+
Balance sheet growth
(positive for NII, negative for NIM)
Driven by strong client liquidity
Rate protections
$22B active loan floors as of 12/31/20
Swaps expected to offer~5 bps of NIM protection in 2021¹
SBA PPP program
Q1'21 NII includes ~$16-18M of estimated SBA PPP loan interest and
fees, net of deferred loan origination costs (+4 bps impact to NIM)
Reduction in average cash balances
To $7-9B target by end of 2021 (actual balances depend on
timing of fund flows)
Low new purchase yields
While previous efforts to extend duration mitigate rolloffs, still
expect $2.5B-$3.OB paydowns per quarter through 2021
Shifting loan mix
Towards lower yielding Global Fund Banking capital call lines
Spread compression
Increasing competition as economy recovers
1. NII is presented on a fully taxable equivalent basis, while NII guidance excludes fully taxable equivalent adjustments.
2. SBA PPP contributed $14.3M to net interest income, including $9.9M of loan fees
3. Includes $12.7M acceleration of discount accretion due to an increase in expected prepayments for fixedate commercial mortgage-
backed securities in our held-to-maturity portfolio, benefiting fixed income portfolio yields by 12 bps and NIM by 5 bps.
4. Unwound $5B swaps in Q1'20 resulting in $227M pretax fair value gains in OCI to be reclassified to loan interest income over 5 years
based on the timing of cash flows from hedged variablerate loans. $179M locked-in gains remain as of December 31, 2020.
5. Based on SBA PPP forgiveness expectations. Estimate only, subject to SBA PPP terms; amounts actually forgiven and timing of
forgiveness may differ. Excludes impact of PPP 2.0.
Q4 2020 Financial Highlights
22View entire presentation