First Busey Results Presentation Deck
2Q23 Earnings Investor Presentation
Focused Control on Expenses
Noninterest Expense
$ in millions
Noninterest Exp.
Unfunded Provision
Acq./Restructuring Exp.
1
Intangible Amort.
NMTC Amort.
Adj. Core Exp. (¹)
Expenses ex-Acq.
$69.1
59.0%
2022 Q2
$69.1
- $0.3
$0.3
$3.0
$1.7
$64.4
$70.7
55.7%
Acq./Restructuring Exp.
2022 Q3
First Busey Corporation | Ticker: BUSE
$70.7
- $0.3
$1.0
$2.9
$1.7
$65.6
$73.7
55.8%
2022 Q4
$73.7
-$0.5
$2.4
$2.8
$1.7
$67.2
Adj. Core Efficiency Ratio ¹
$70.4
55.6%
2023 Q1
$70.4
-$0.6
$0.0
$2.7
$2.2
$66.1
$69.2
58.6%
2023 Q2
$69.2
$0.3
$0.0
$2.7
$2.3
$64.0
■
I
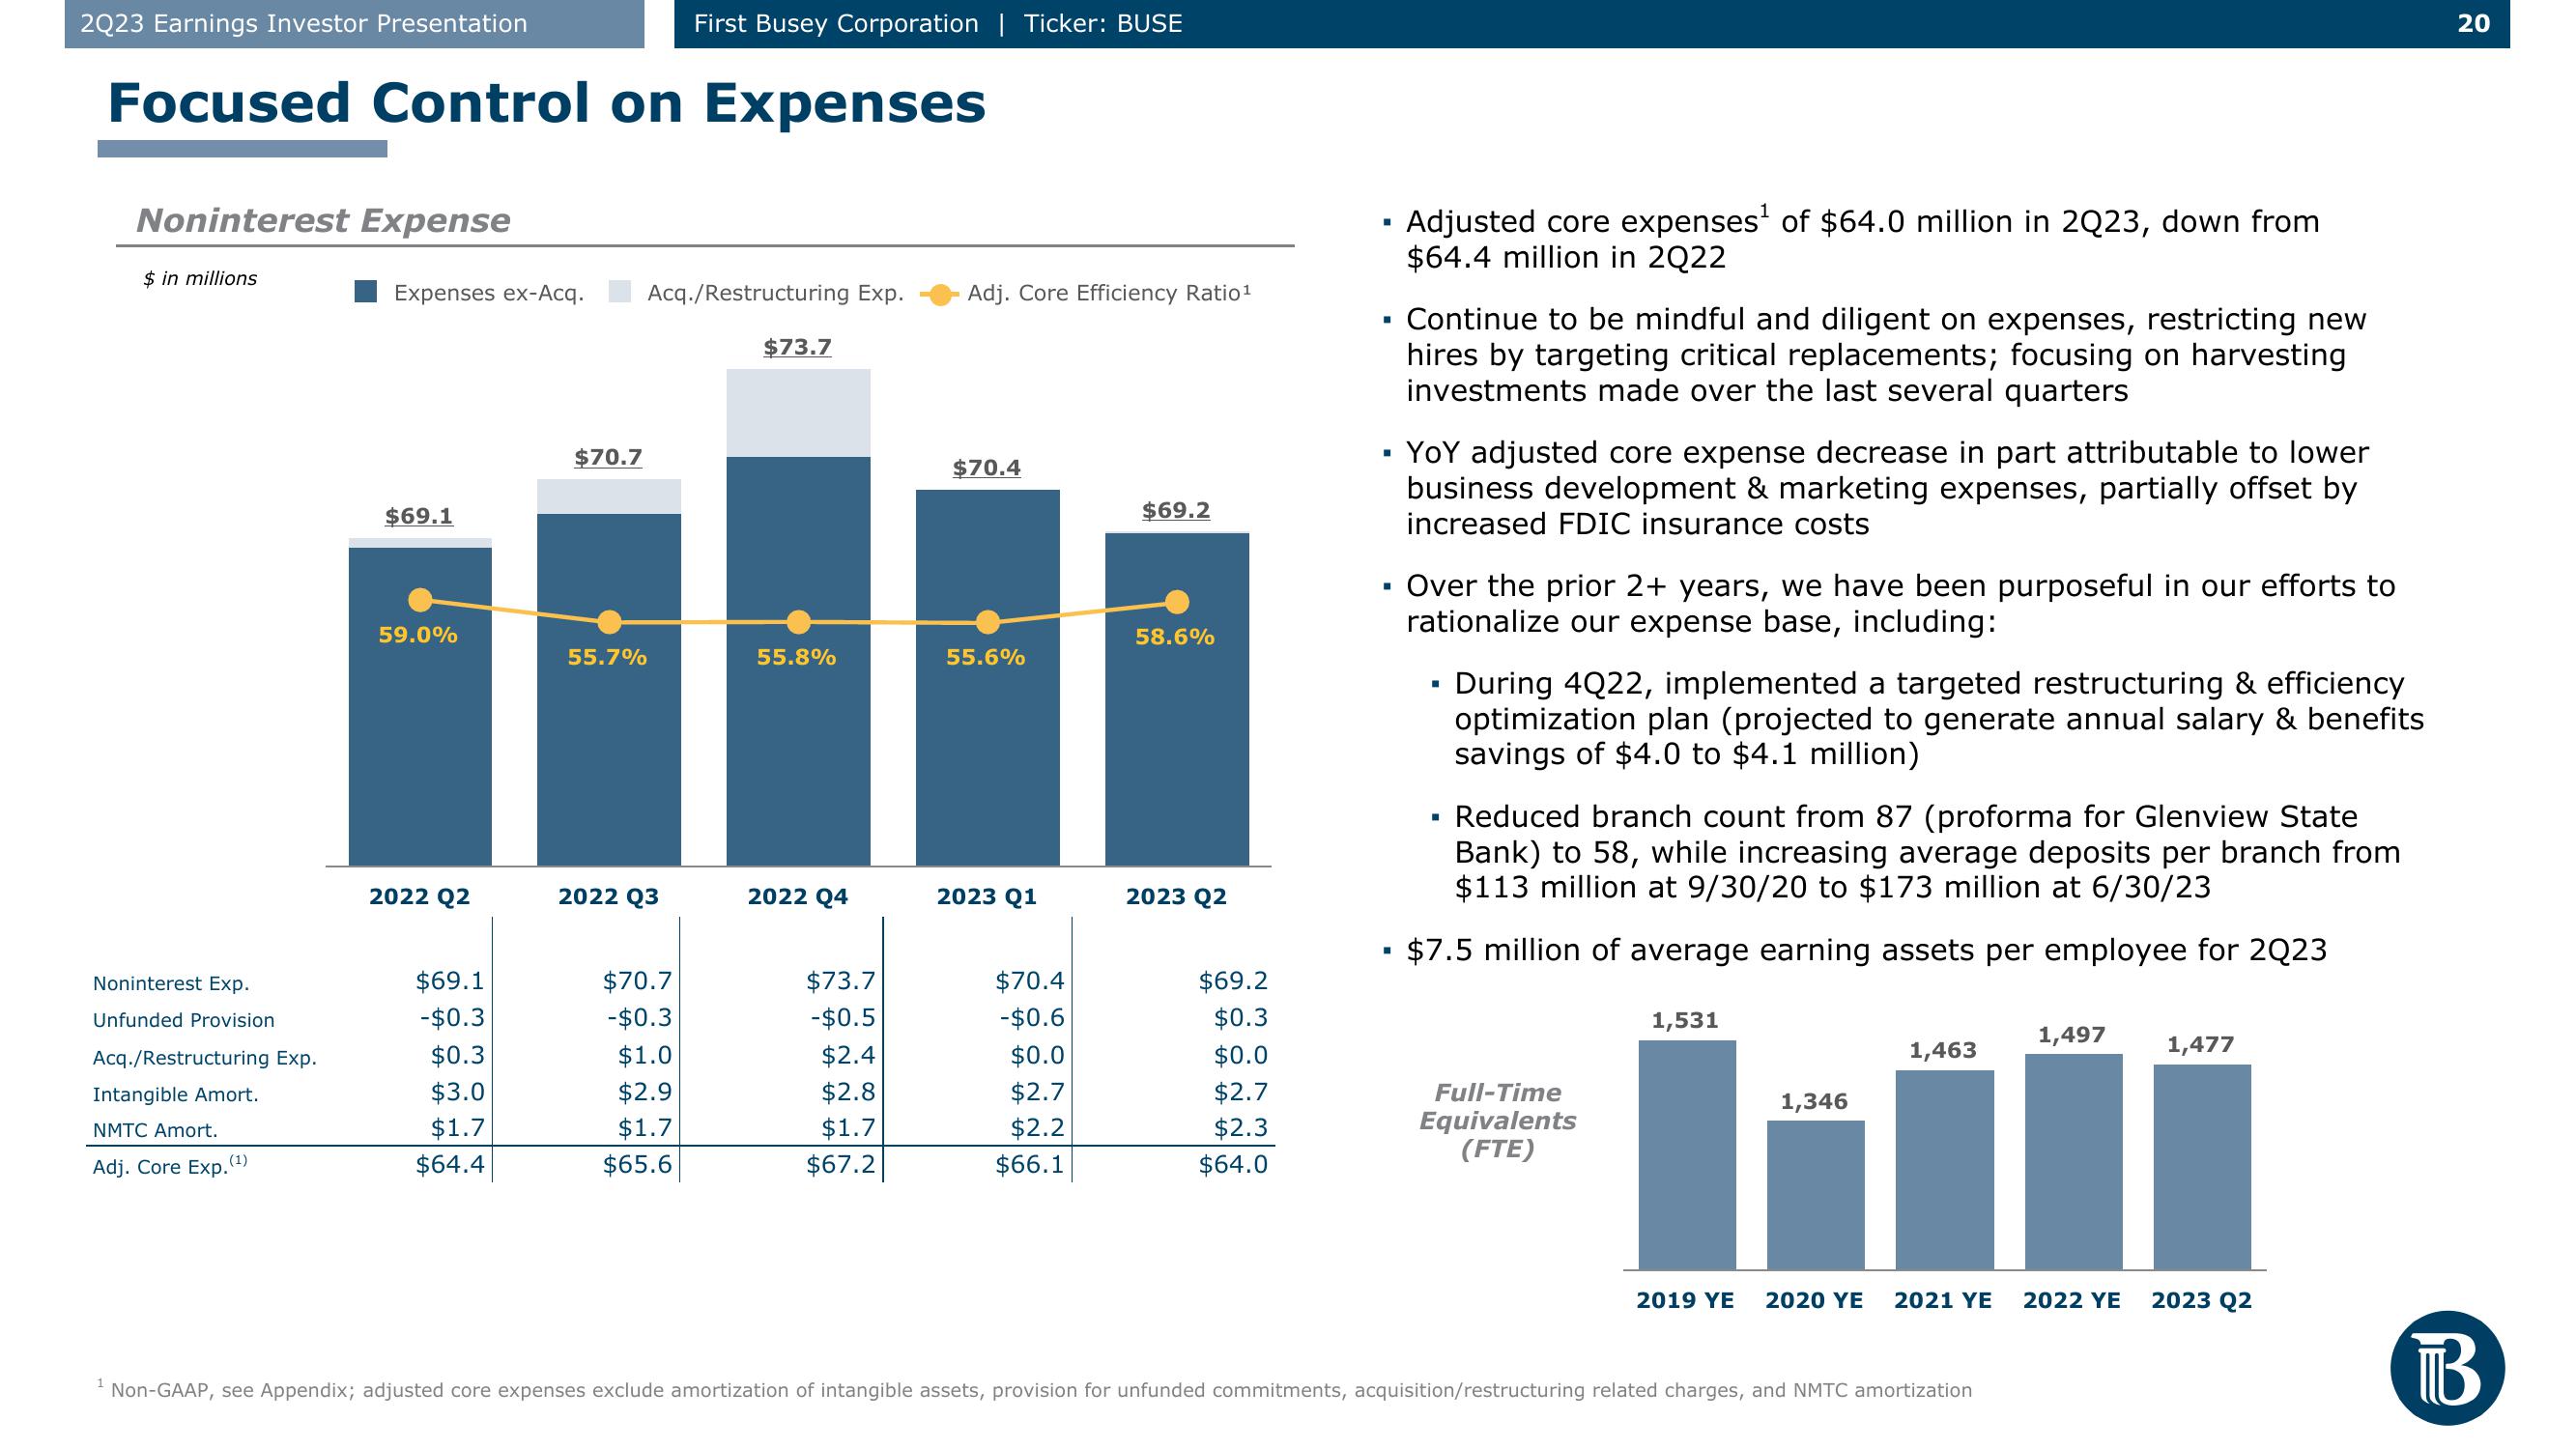
Adjusted core expenses¹ of $64.0 million in 2Q23, down from
$64.4 million in 2Q22
Continue to be mindful and diligent on expenses, restricting new
hires by targeting critical replacements; focusing on harvesting
investments made over the last several quarters
YOY adjusted core expense decrease in part attributable to lower
business development & marketing expenses, partially offset by
increased FDIC insurance costs
▪ Over the prior 2+ years, we have been purposeful in our efforts to
rationalize our expense base, including:
During 4Q22, implemented a targeted restructuring & efficiency
optimization plan (projected to generate annual salary & benefits
savings of $4.0 to $4.1 million)
Reduced branch count from 87 (proforma for Glenview State
Bank) to 58, while increasing average deposits per branch from
$113 million at 9/30/20 to $173 million at 6/30/23
$7.5 million of average earning assets per employee for 2Q23
Full-Time
Equivalents
(FTE)
1,531
1,346
1,463
2019 YE 2020 YE 2021 YE
Non-GAAP, see Appendix; adjusted core expenses exclude amortization of intangible assets, provision for unfunded commitments, acquisition/restructuring related charges, and NMTC amortization
1,497
2022 YE
1,477
2023 Q2
20
BView entire presentation