Wirecard Results Presentation Deck
in EUR million
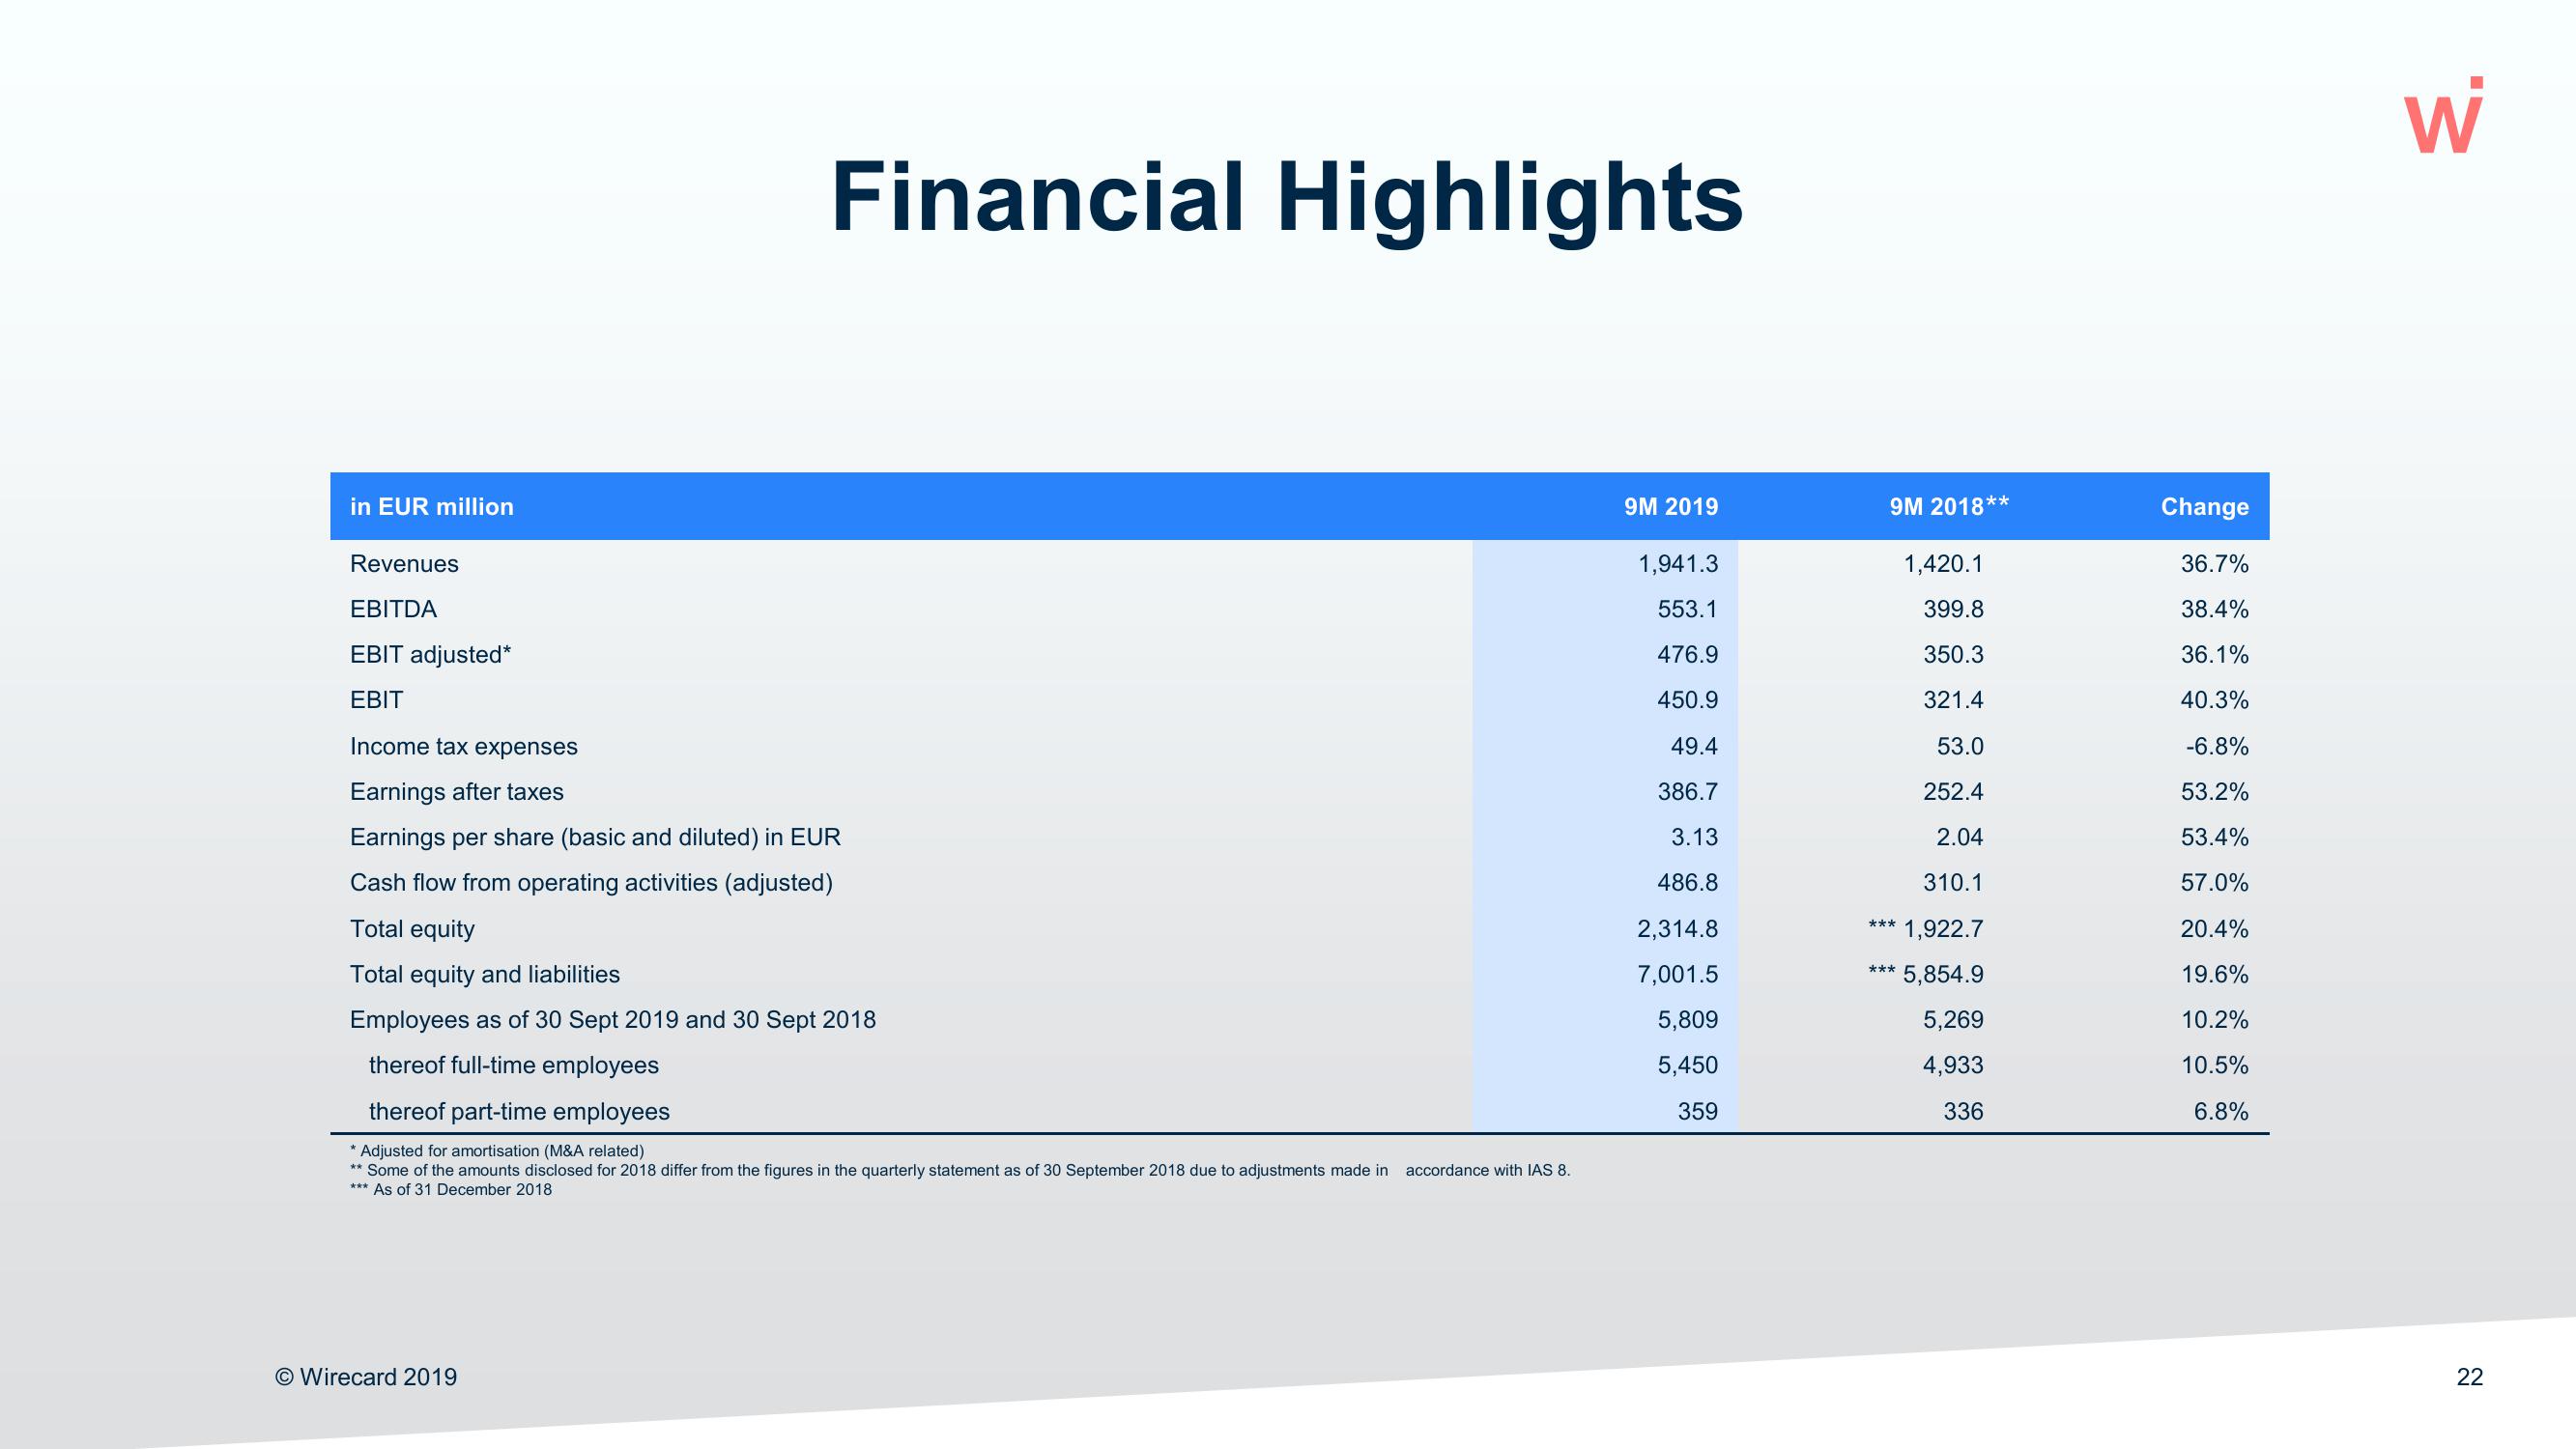
Financial Highlights
Revenues
EBITDA
EBIT adjusted*
EBIT
Income tax expenses
Earnings after taxes
Earnings per share (basic and diluted) in EUR
Cash flow from operating activities (adjusted)
Total equity
Total equity and liabilities
Employees as of 30 Sept 2019 and 30 Sept 2018
thereof full-time employees
thereof part-time employees
* Adjusted for amortisation (M&A related)
** Some of the amounts disclosed for 2018 differ from the figures in the quarterly statement as of 30 September 2018 due to adjustments made in accordance with IAS 8.
*** As of 31 December 2018
O Wirecard 2019
9M 2019
1,941.3
553.1
476.9
450.9
49.4
386.7
3.13
486.8
2,314.8
7,001.5
5,809
5,450
359
9M 2018**
1,420.1
399.8
350.3
321.4
53.0
252.4
2.04
310.1
*** 1,922.7
*** 5,854.9
5,269
4,933
336
Change
36.7%
38.4%
36.1%
40.3%
-6.8%
53.2%
53.4%
57.0%
20.4%
19.6%
10.2%
10.5%
6.8%
W
22View entire presentation