W3BCLOUD SPAC
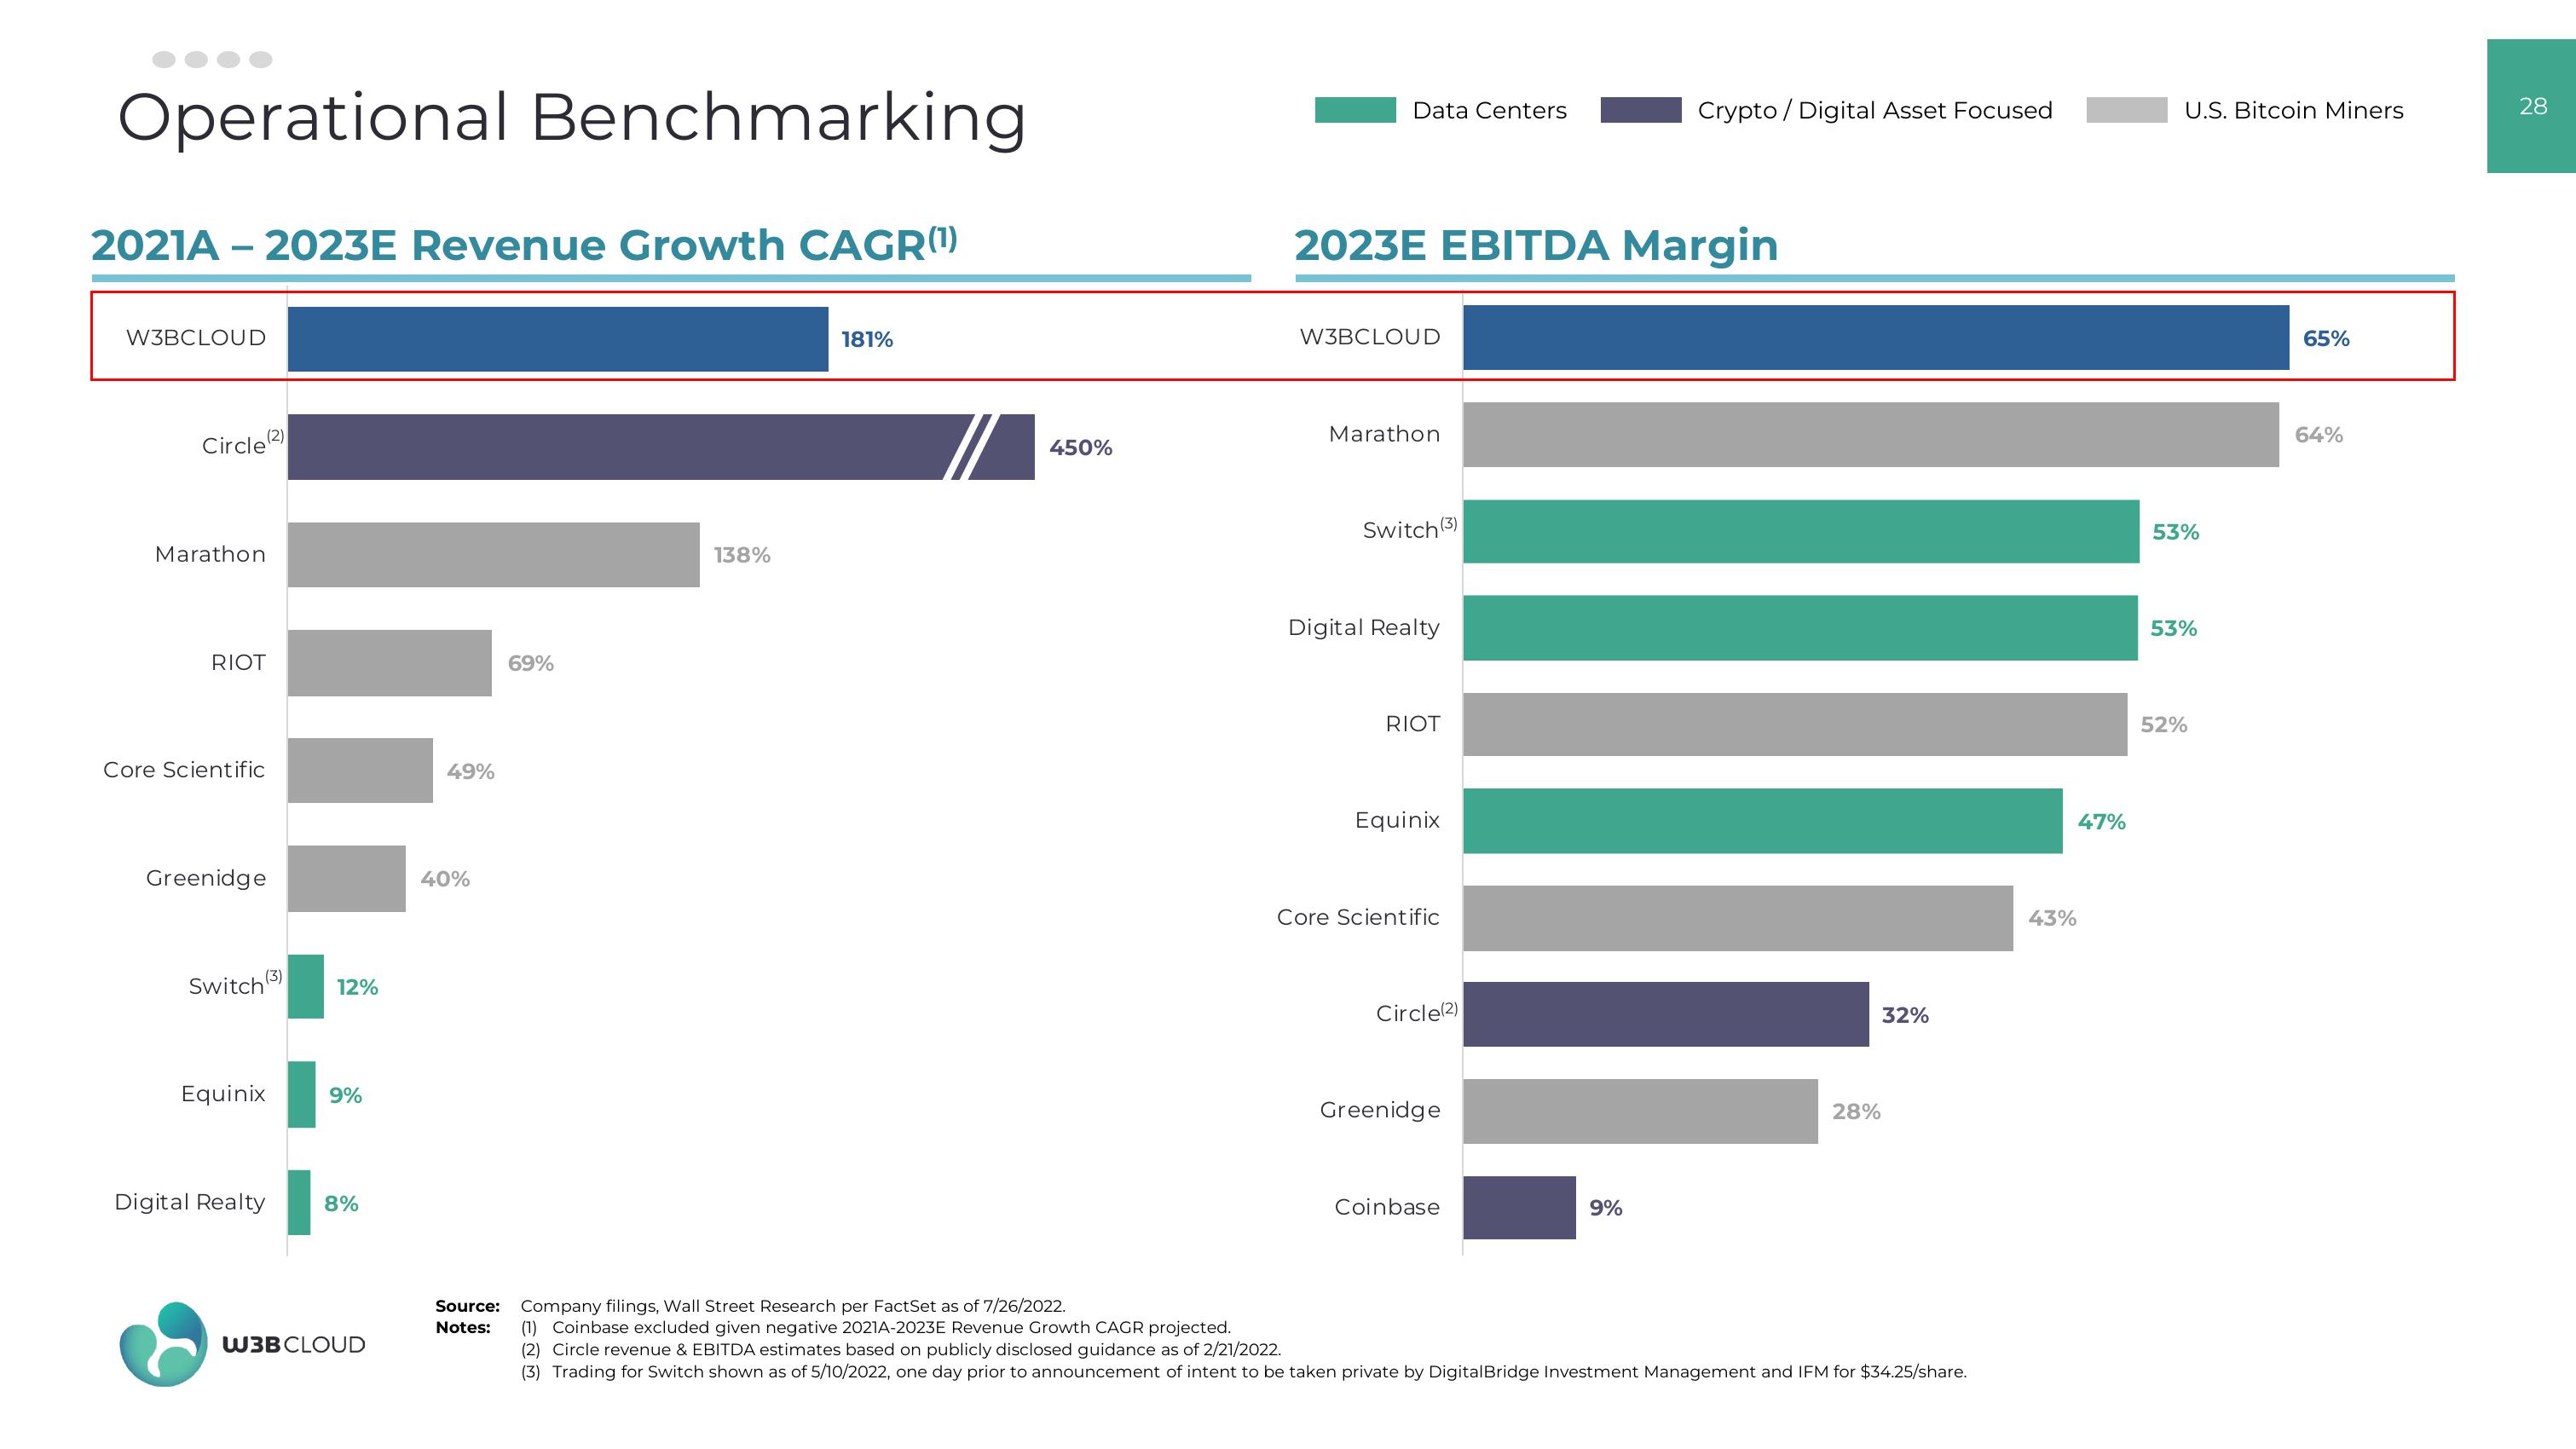
Operational Benchmarking
2021A - 2023E Revenue Growth CAGR(¹)
W3BCLOUD
Circle (2)
Marathon
RIOT
Core Scientific
Greenidge
Switch
(3)
Equinix
Digital Realty
12%
9%
8%
W3B CLOUD
49%
40%
69%
138%
181%
450%
Source: Company filings, Wall Street Research per FactSet as of 7/26/2022.
Notes:
Data Centers
2023E EBITDA Margin
W3BCLOUD
Marathon
Switch (3)
Digital Realty
RIOT
Equinix
Core Scientific
Circle(2)
Greenidge
Coinbase
Crypto/ Digital Asset Focused
9%
28%
32%
(1) Coinbase excluded given negative 2021A-2023E Revenue Growth CAGR projected.
(2) Circle revenue & EBITDA estimates based on publicly disclosed guidance as of 2/21/2022.
(3) Trading for Switch shown as of 5/10/2022, one day prior to announcement of intent to be taken private by Digital Bridge Investment Management and IFM for $34.25/share.
43%
47%
U.S. Bitcoin Miners
53%
53%
52%
65%
64%
28View entire presentation