Q2 FY24 Earnings Presentation
Q3 FY24 guidance
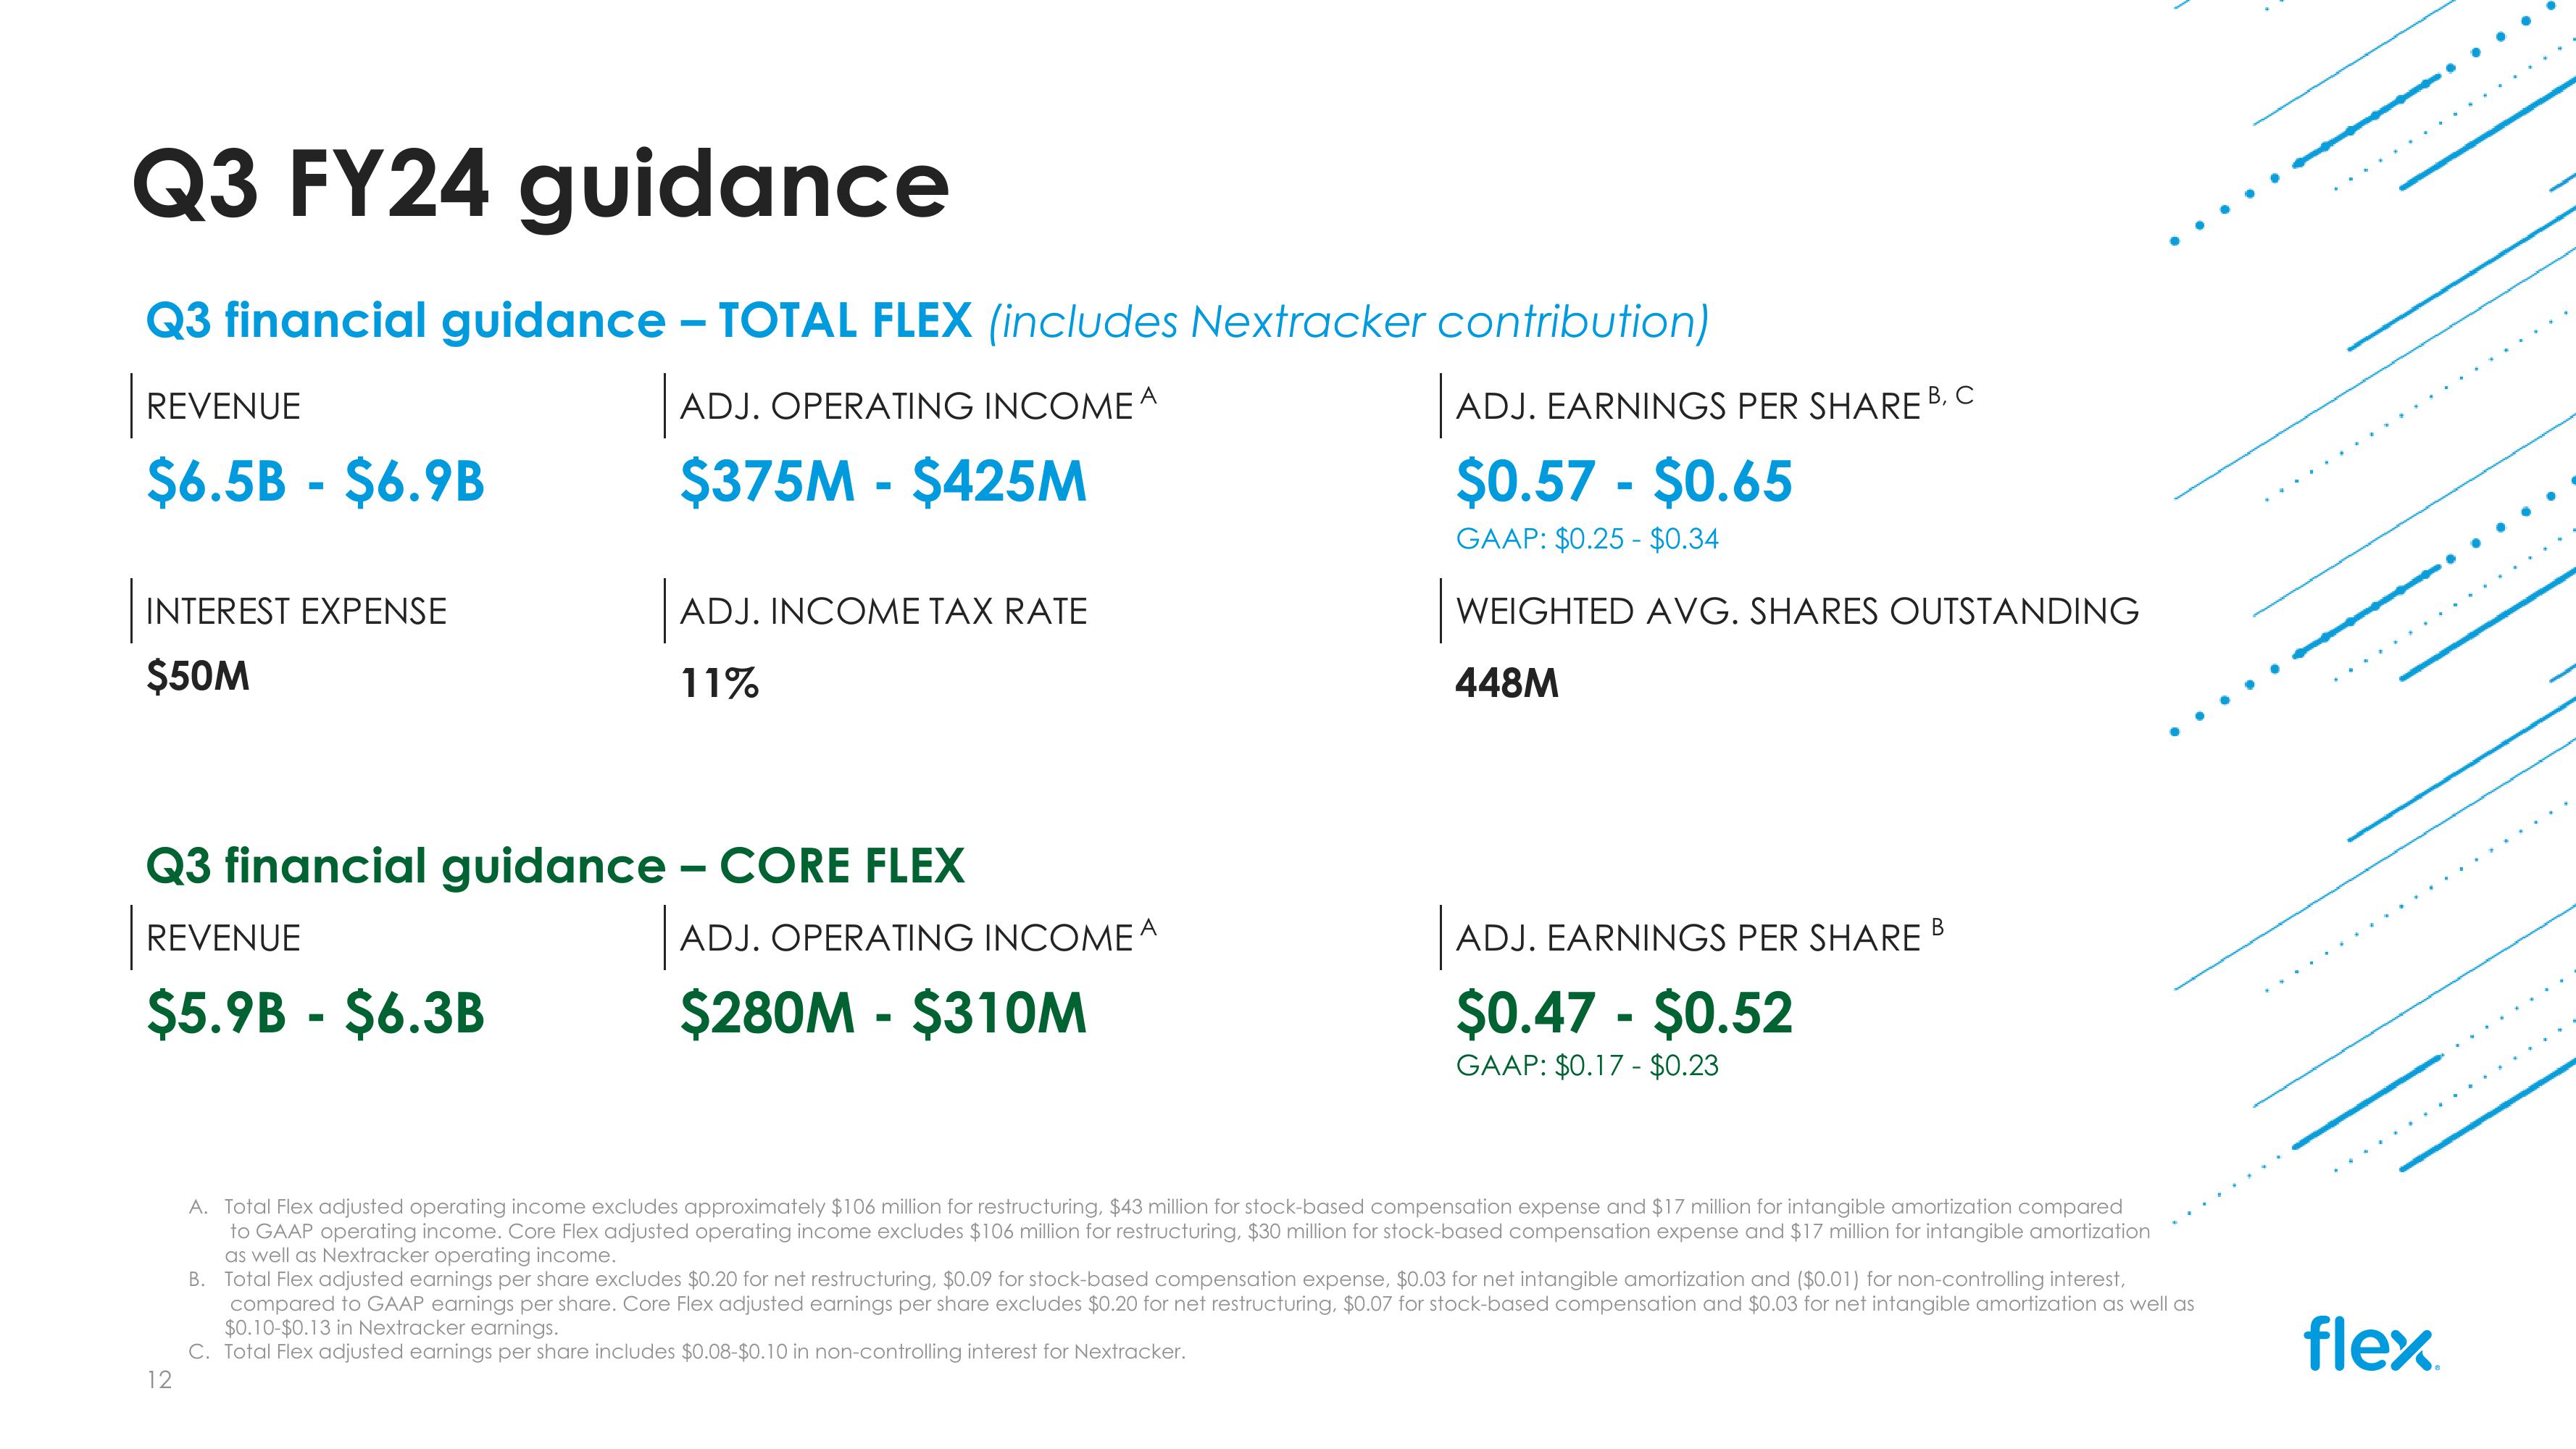
Q3 financial guidance – TOTAL FLEX (includes Nextracker contribution)
REVENUE
$6.5B $6.9B
-
-
ADJ. OPERATING INCOME A
$375M - $425M
| ADJ. EARNINGS PER SHARE B. C
$0.57 - $0.65
GAAP: $0.25 - $0.34
WEIGHTED AVG. SHARES OUTSTANDING
INTEREST EXPENSE
$50M
ADJ. INCOME TAX RATE
11%
448M
Q3 financial guidance - CORE FLEX
REVENUE
-
$5.9B $6.3B
ADJ. OPERATING INCOME A
$280M - $310M
| ADJ. EARNINGS PER SHARE
$0.47 - $0.52
GAAP: $0.17 - $0.23
12
A. Total Flex adjusted operating income excludes approximately $106 million for restructuring, $43 million for stock-based compensation expense and $17 million for intangible amortization compared
to GAAP operating income. Core Flex adjusted operating income excludes $106 million for restructuring, $30 million for stock-based compensation expense and $17 million for intangible amortization
as well as Nextracker operating income.
B. Total Flex adjusted earnings per share excludes $0.20 for net restructuring, $0.09 for stock-based compensation expense, $0.03 for net intangible amortization and ($0.01) for non-controlling interest,
compared to GAAP earnings per share. Core Flex adjusted earnings per share excludes $0.20 for net restructuring, $0.07 for stock-based compensation and $0.03 for net intangible amortization as well as
$0.10-$0.13 in Nextracker earnings.
C. Total Flex adjusted earnings per share includes $0.08-$0.10 in non-controlling interest for Nextracker.
flexView entire presentation