Kinnevik Results Presentation Deck
Intro
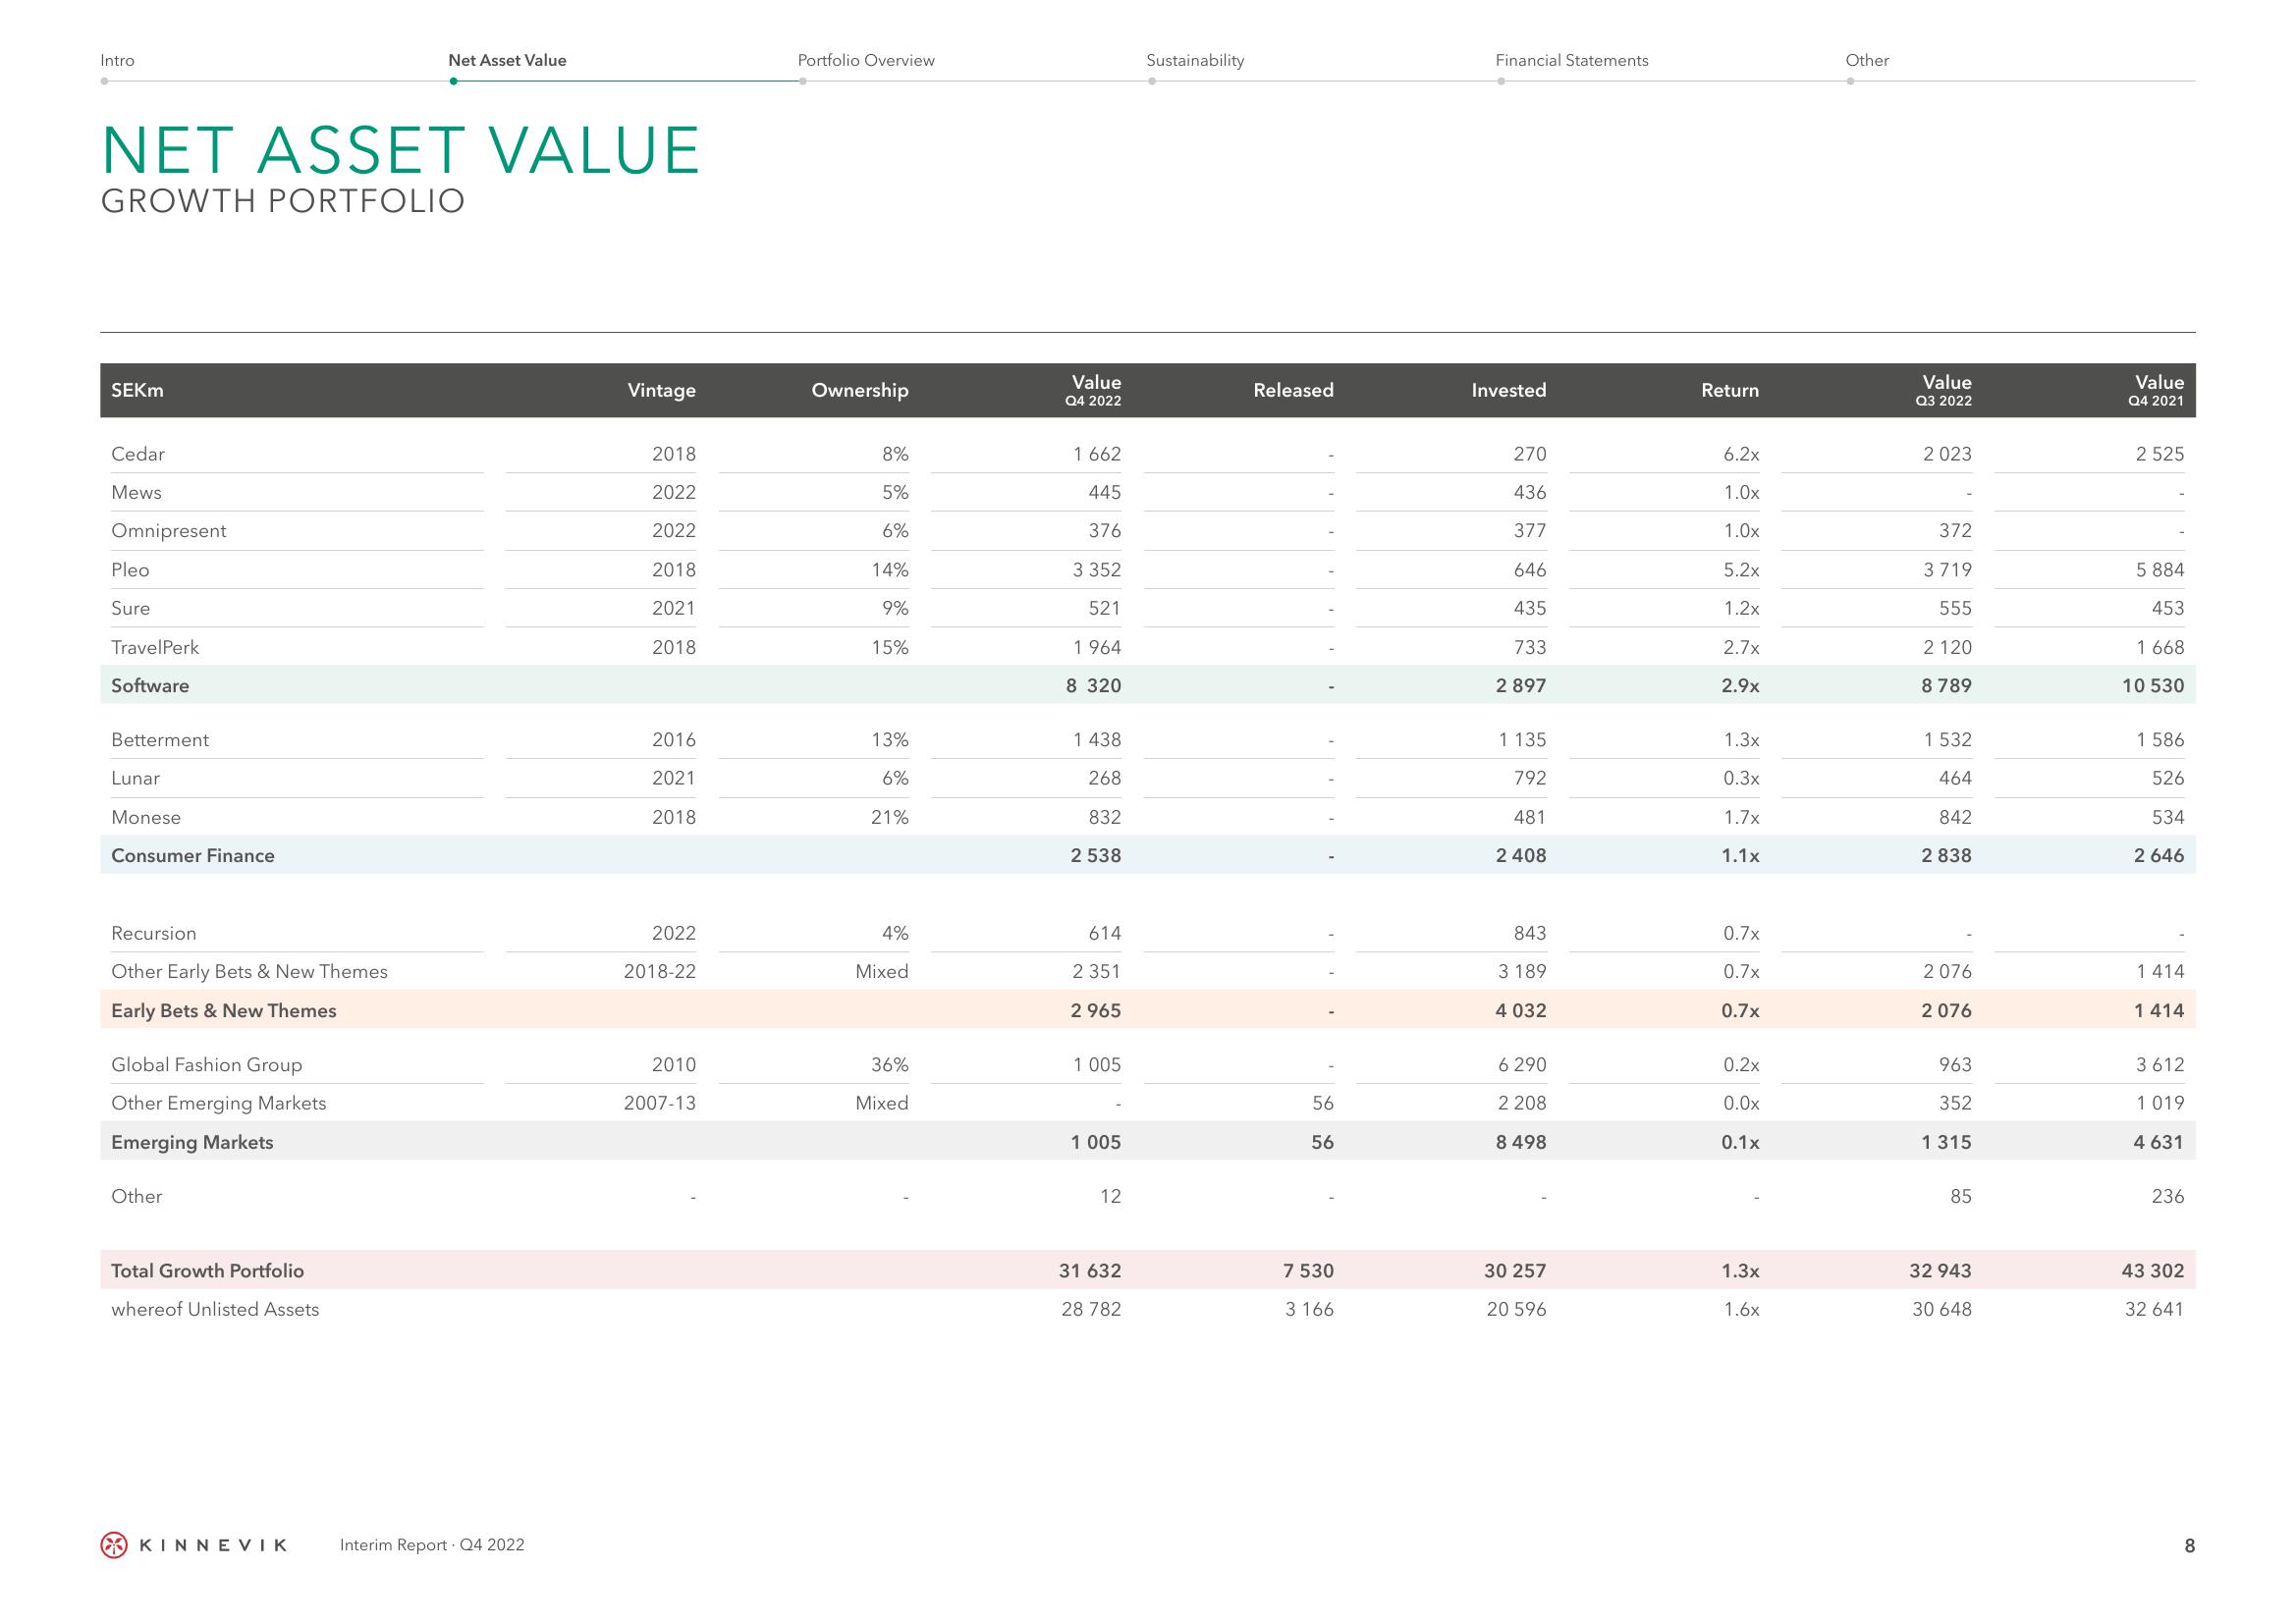
NET ASSET VALUE
GROWTH PORTFOLIO
SEKM
Cedar
Mews
Omnipresent
Pleo
Sure
TravelPerk
Software
Betterment
Lunar
Monese
Consumer Finance
Recursion
Other Early Bets & New Themes
Early Bets & New Themes
Global Fashion Group
Other Emerging Markets
Emerging Markets
Other
Total Growth Portfolio
whereof Unlisted Assets
Net Asset Value
KINNEVIK
Interim Report. Q4 2022
Vintage
2018
2022
2022
2018
2021
2018
2016
2021
2018
2022
2018-22
2010
2007-13
Portfolio Overview
Ownership
8%
5%
6%
14%
9%
15%
13%
6%
21%
4%
Mixed
36%
Mixed
Value
Q4 2022
1662
445
376
3 352
521
1964
8 320
1 438
268
832
2 538
614
2 351
2 965
1 005
1 005
12
31 632
28 782
Sustainability
Released
56
56
7 530
3 166
Financial Statements
Invested
270
436
377
646
435
733
2 897
1 135
792
481
2 408
843
3 189
4 032
6 290
2 208
8 498
30 257
20 596
Return
6.2x
1.0x
1.0x
5.2x
1.2x
2.7x
2.9x
1.3x
0.3x
1.7x
1.1x
0.7x
0.7x
0.7x
0.2x
0.0x
0.1x
1.3x
1.6x
Other
Value
Q3 2022
2 023
372
3719
555
2 120
8 789
1 532
464
842
2 838
2 076
2 076
963
352
1315
85
32 943
30 648
Value
Q4 2021
25
5 884
453
1 668
10 530
1 586
526
534
2 646
1 414
1414
3 612
1 019
4 631
236
43 302
32 641
8View entire presentation