SoftBank Results Presentation Deck
Current Market Environment
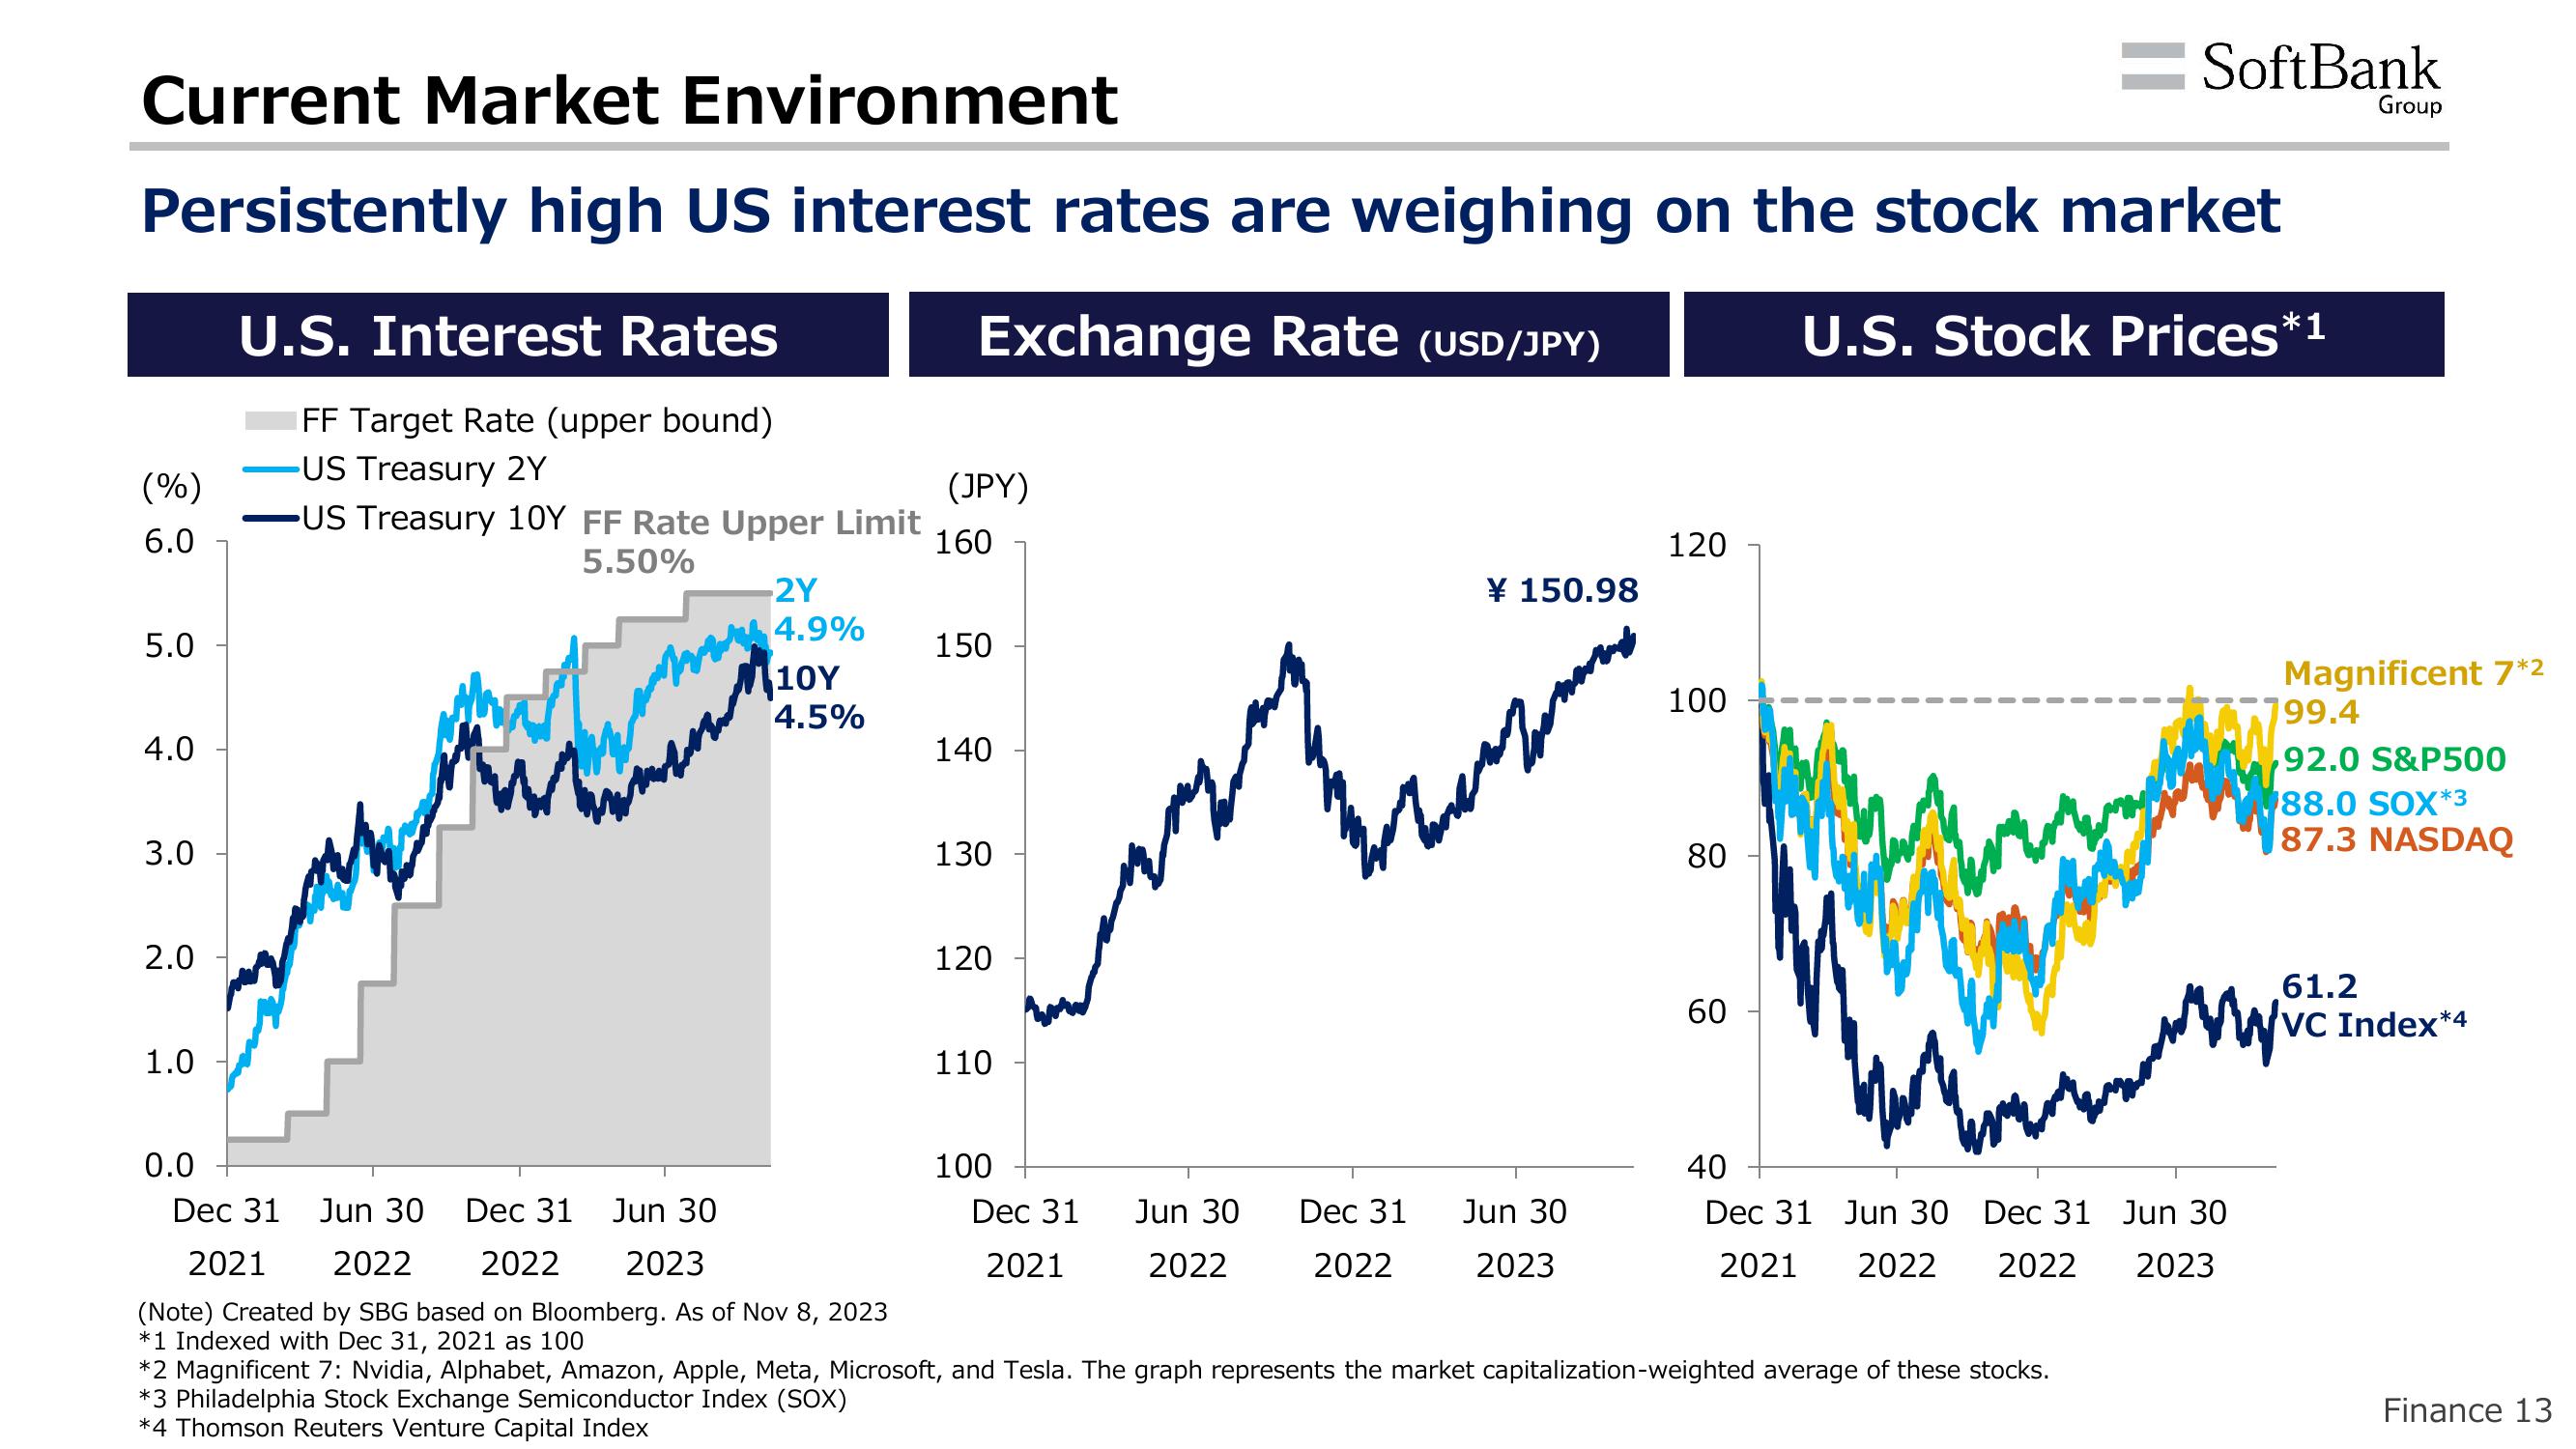
Persistently high US interest rates are weighing on the stock market
Exchange Rate (USD/JPY)
U.S. Stock Prices
(%)
6.0
5.0
4.0
3.0
2.0
1.0
0.0
U.S. Interest Rates
FF Target Rate (upper bound)
-US Treasury 2Y
US Treasury 10Y FF Rate Upper Limit
5.50%
www
-2Y
4.9%
|1ΟΥ
4.5%
(JPY)
160
150
140
130
120
110
100
Dec 31
2021
berken
Jun 30
2022
¥150.98
Dec 31
2022
120
Jun 30
2023
100
Dec 31 Jun 30
Dec 31
Jun 30
2022 2022 2023
2021
(Note) Created by SBG based on Bloomberg. As of Nov 8, 2023
*1 Indexed with Dec 31, 2021 as 100
*2 Magnificent 7: Nvidia, Alphabet, Amazon, Apple, Meta, Microsoft, and Tesla. The graph represents the market capitalization-weighted average of these stocks.
*3 Philadelphia Stock Exchange Semiconductor Index (SOX)
*4 Thomson Reuters Venture Capital Index
80
60
40
Dec 31 Jun 30
2021 2022 2022
SoftBank
14
Dec 31 Jun 30
2023
.*1
Group
Magnificent 7*2
799.4
92.0 S&P500
88.0 SOX*3
87.3 NASDAQ
61.2
VC Index*4
Finance 13View entire presentation