GitLab Investor Presentation Deck
A single application enables executive
visibility across value streams
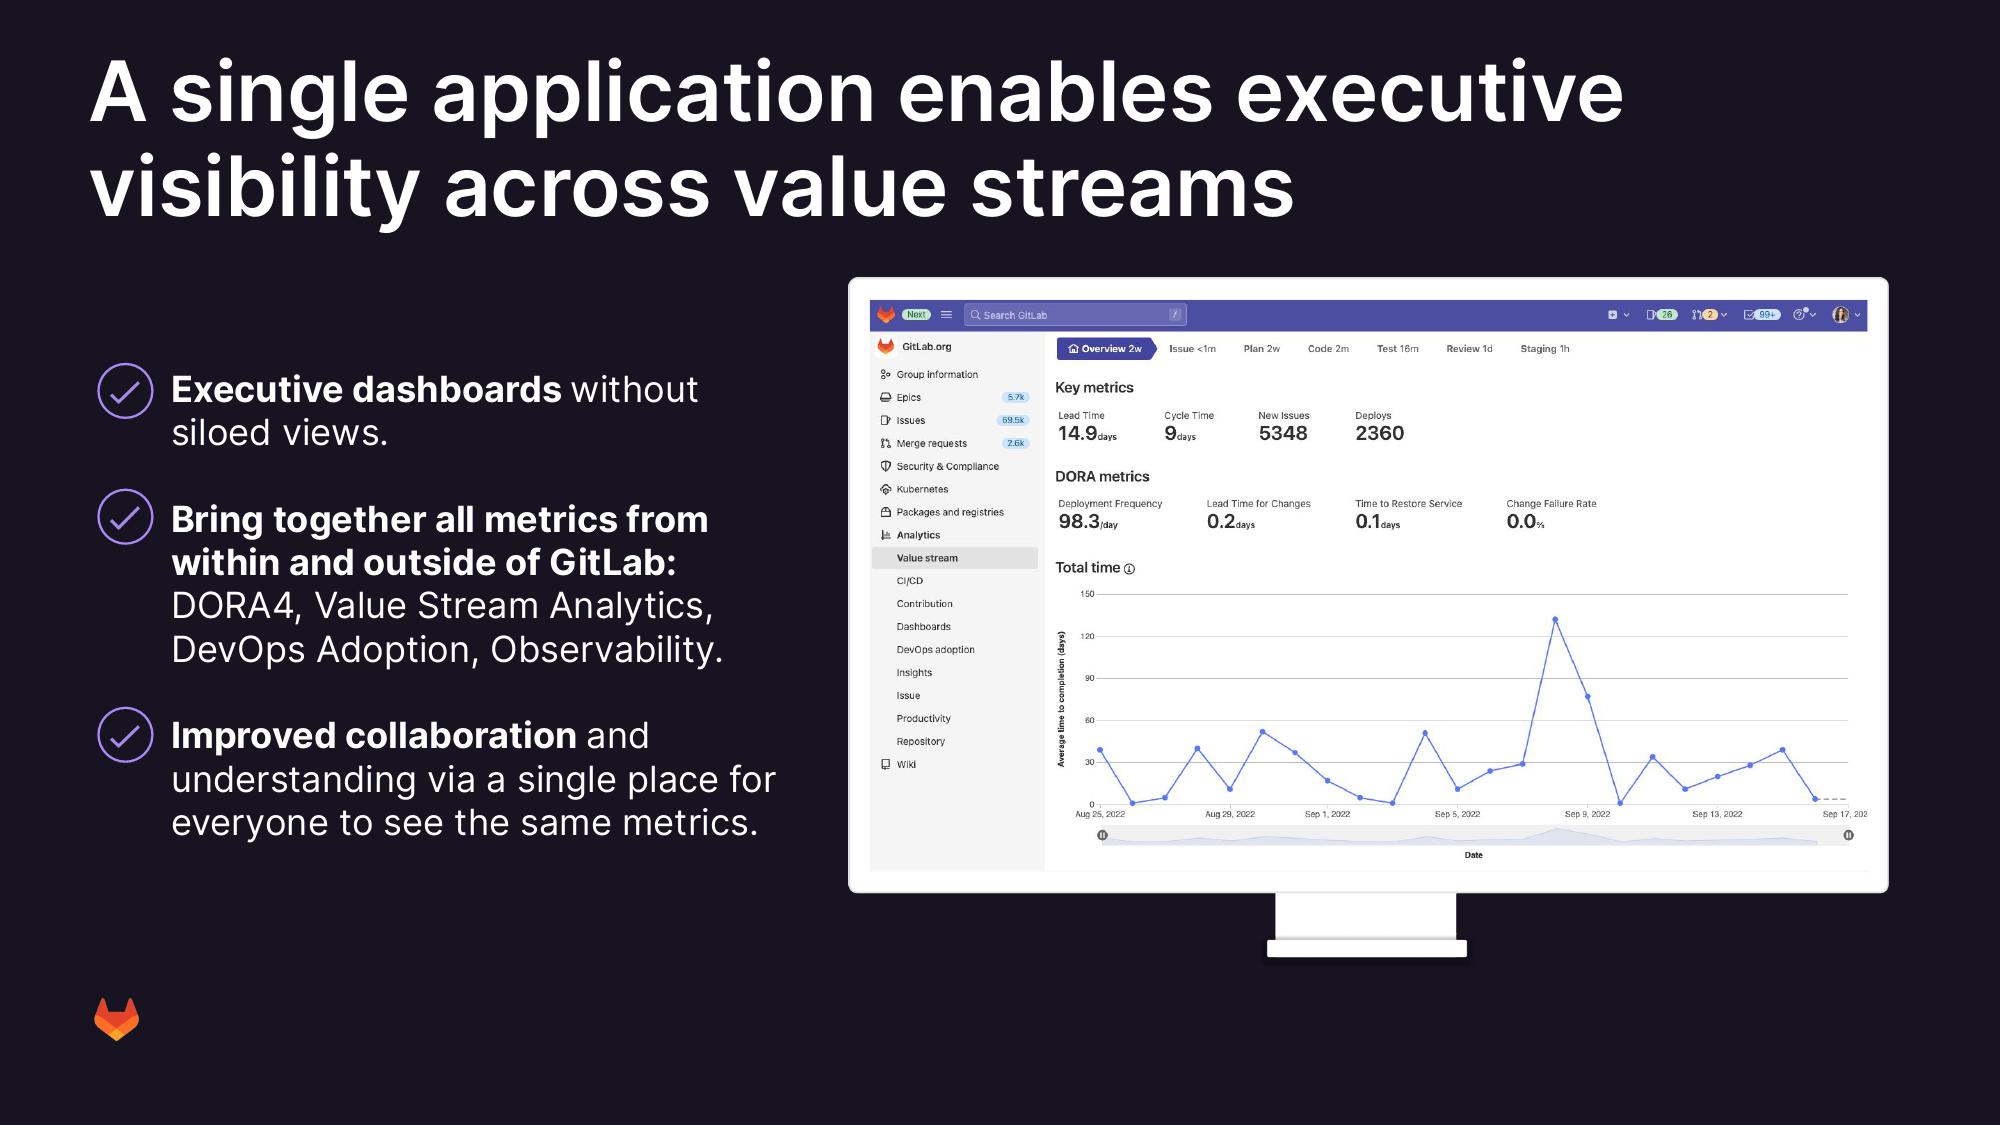
Executive dashboards without
siloed views.
Bring together all metrics from
within and outside of GitLab:
DORA4, Value Stream Analytics,
DevOps Adoption, Observability.
Improved collaboration and
understanding via a single place for
everyone to see the same metrics.
Next = Q Search GitLab
GitLab.org
go Group information
Epics
Issues
Merge requests
Security & Compliance.
Kubernetes
Packages and registries
Analytics
Value stream
CI/CD
Contribution
Dashboards
DevOps adoption.
Insights
Issue
Productivity
Repository
Wiki
5.7k
69.5k
2.6k
Overview 2w
Key metrics
Lead Time
14.9 days
DORA metrics
Deployment Frequency
98.3/day
Total time
150
120
90
Aug 25, 2022
Issue <1m
Ⓡ
Cycle Time
9 days
Plan 2w
Code 2m
New Issues
5348
Lead Time for Changes
0.2days
Aug 29, 2022
Test 16m
Deploys
2360
Review 1d
Time to Restore Service
0.1 days
Esit
Sep 1, 2022
Sep 5, 2022
Staging 1h
Date
Change Failure Rate.
0.0%
V
Sep 9, 2022
26 172-
Sep 13, 2022
99+
@
Sep 17, 202View entire presentation