Ashtead Group Results Presentation Deck
US TRADING
May
Q1
Q2
Q4
General tool
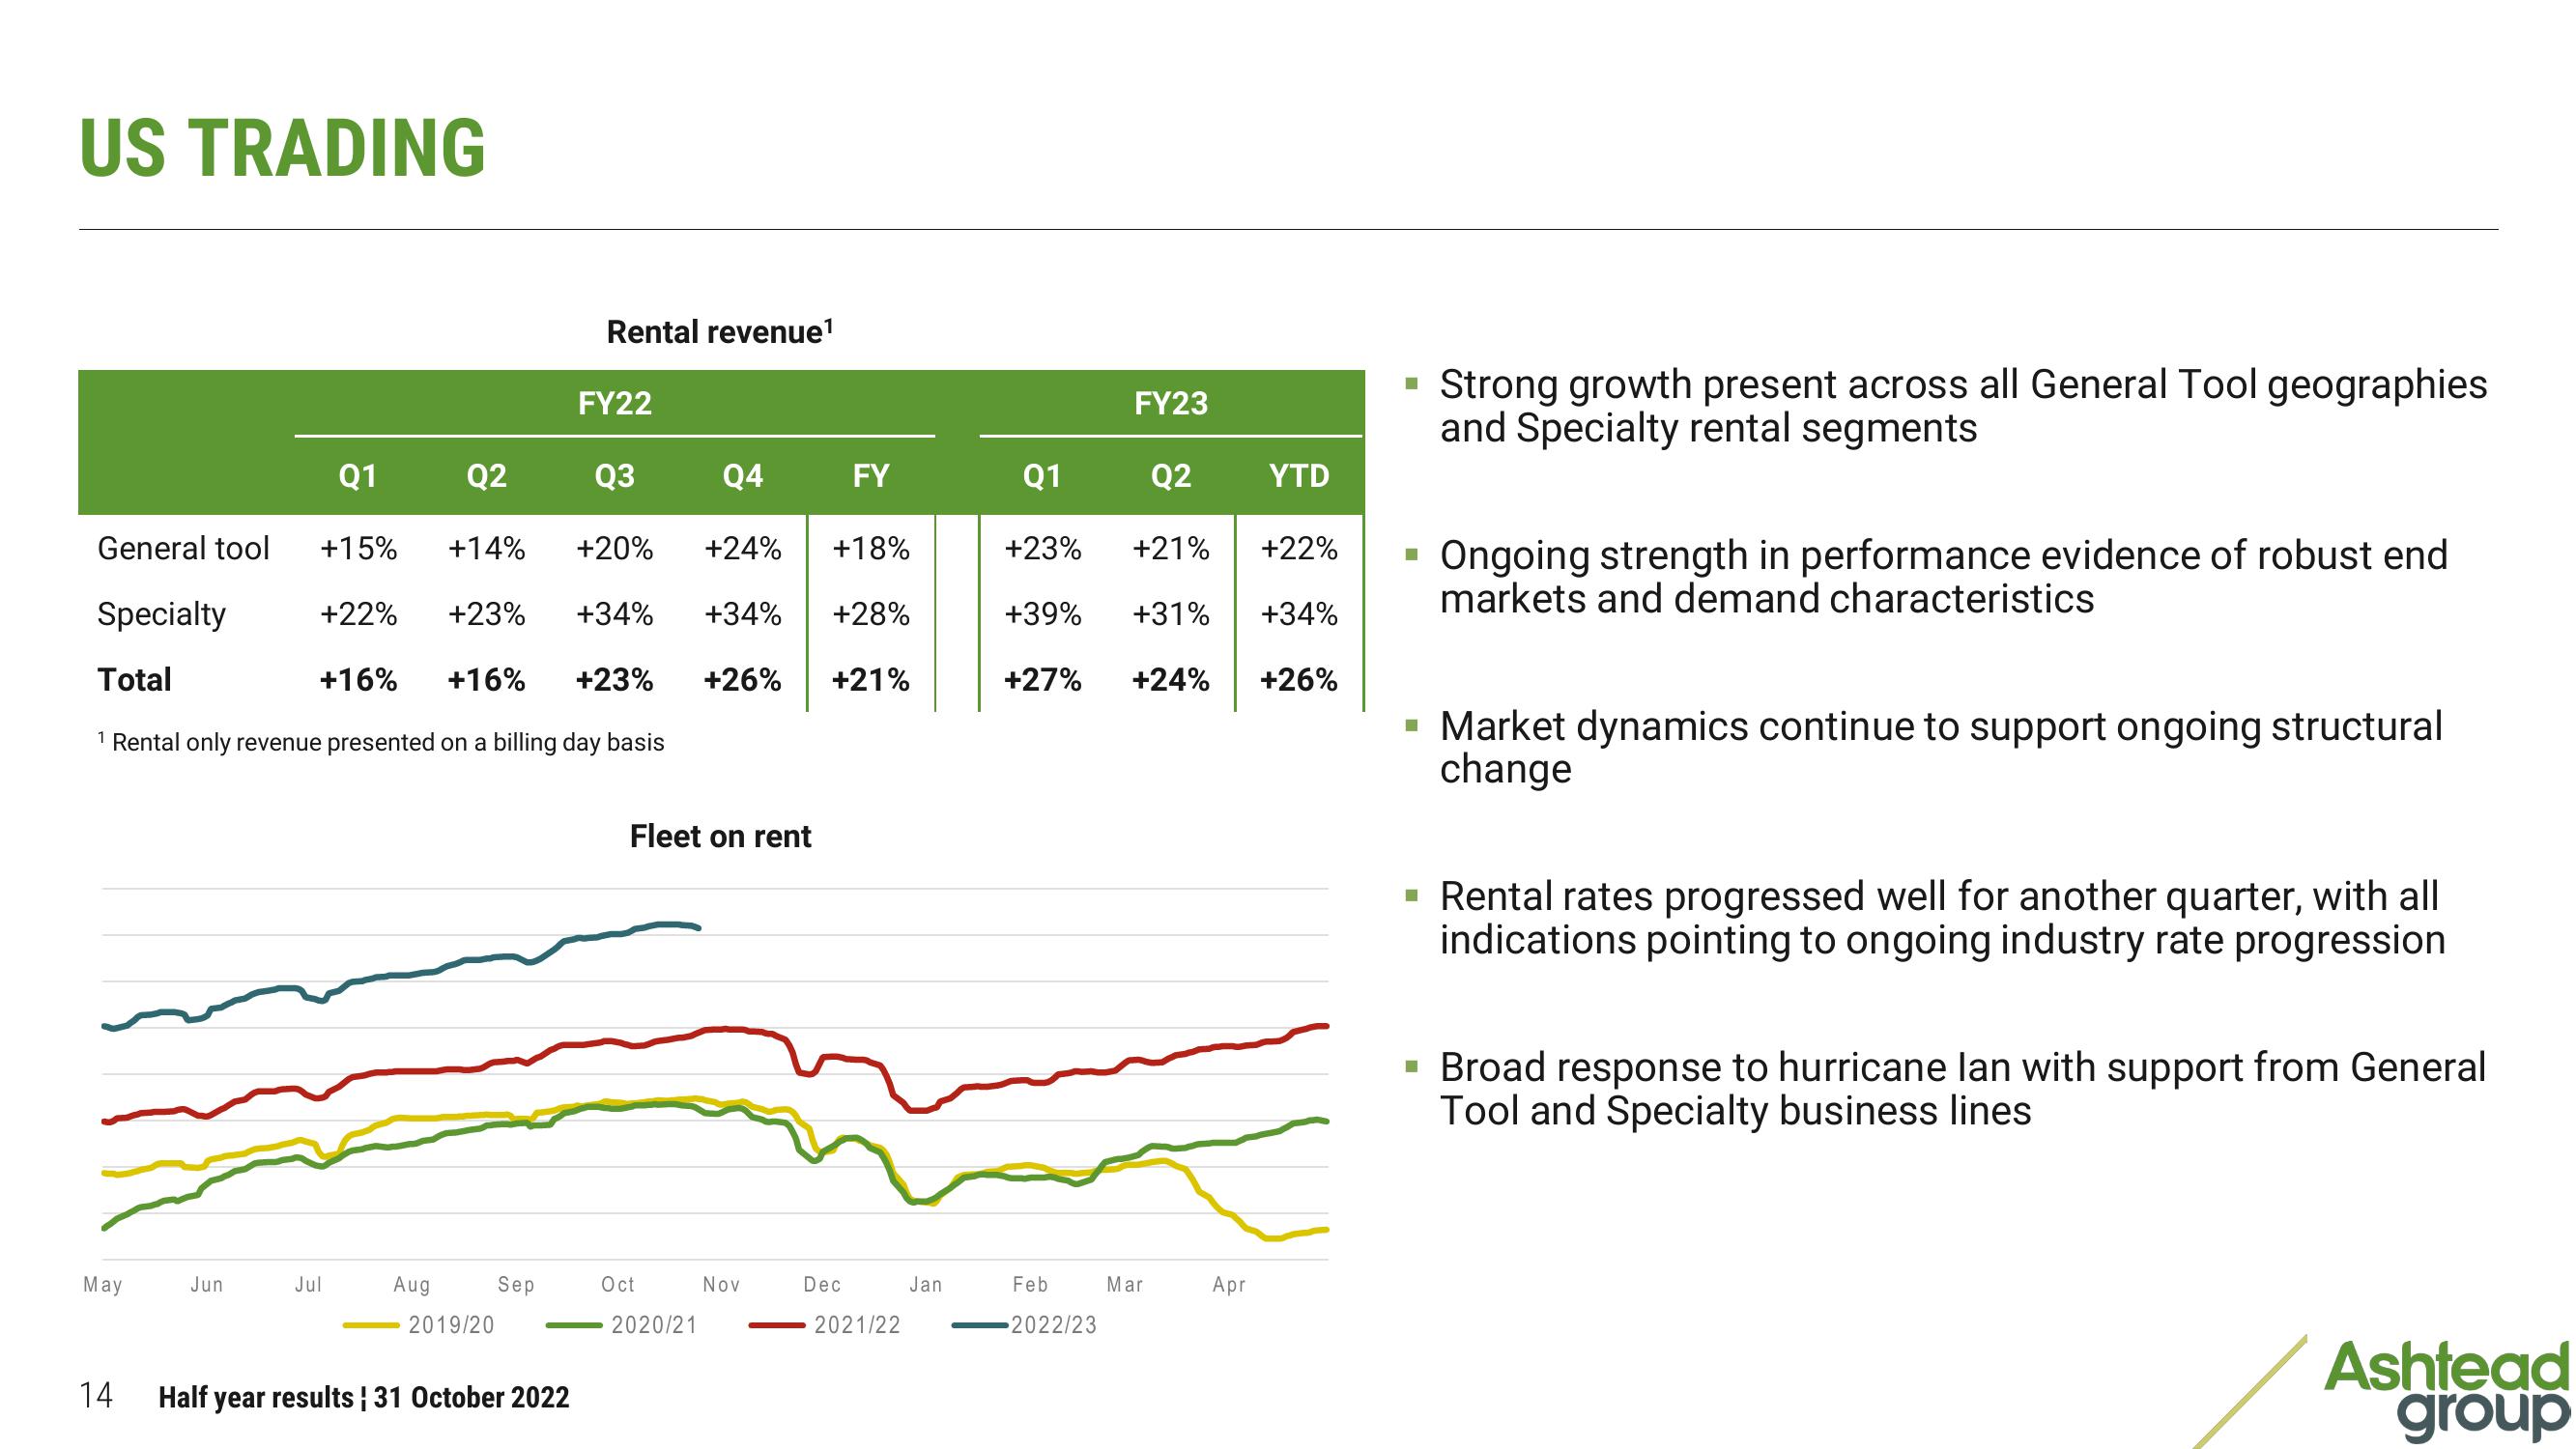
+15% +14% +20%
+24%
+18%
+22% +23% +34% +34% +28%
Specialty
Total
+16% +16% +23%
+26% +21%
1 Rental only revenue presented on a billing day basis
14
Jun
Jul
Aug
2019/20
Sep
Rental revenue¹
Half year results ¦ 31 October 2022
FY22
Q3
Fleet on rent
Oct
2020/21
Nov
Dec
FY
2021/22
Jan
Q1
+23%
+39% +31%
+27%
+24%
Feb
FY23
2022/23
Q2
+21% +22%
+34%
+26%
Mar
YTD
Apr
■
■
Strong growth present across all General Tool geographies
and Specialty rental segments
Ongoing strength in performance evidence of robust end
markets and demand characteristics
Market dynamics continue to support ongoing structural
change
▪ Rental rates progressed well for another quarter, with all
indications pointing to ongoing industry rate progression
▪ Broad response to hurricane lan with support from General
Tool and Specialty business lines
Ashtead
groupView entire presentation