MoneyLion Investor Day Presentation Deck
Scale
Growth
Performance
MoneyLion
●
●
●
MoneyLion at a Glance
5.4M Total Customers
11.3M Total Products
700+ Global Employees
4 Offices
101% Y/Y Total Customers growth in Q3 2022
63% Y/Y Total Originations growth in Q3 2022
103% Y/Y Adjusted Revenue growth in Q3 2022
55%+ Adjusted Gross Profit margin
$68 ARPU for Q3 2022
< 6 month payback period on customer acquisition
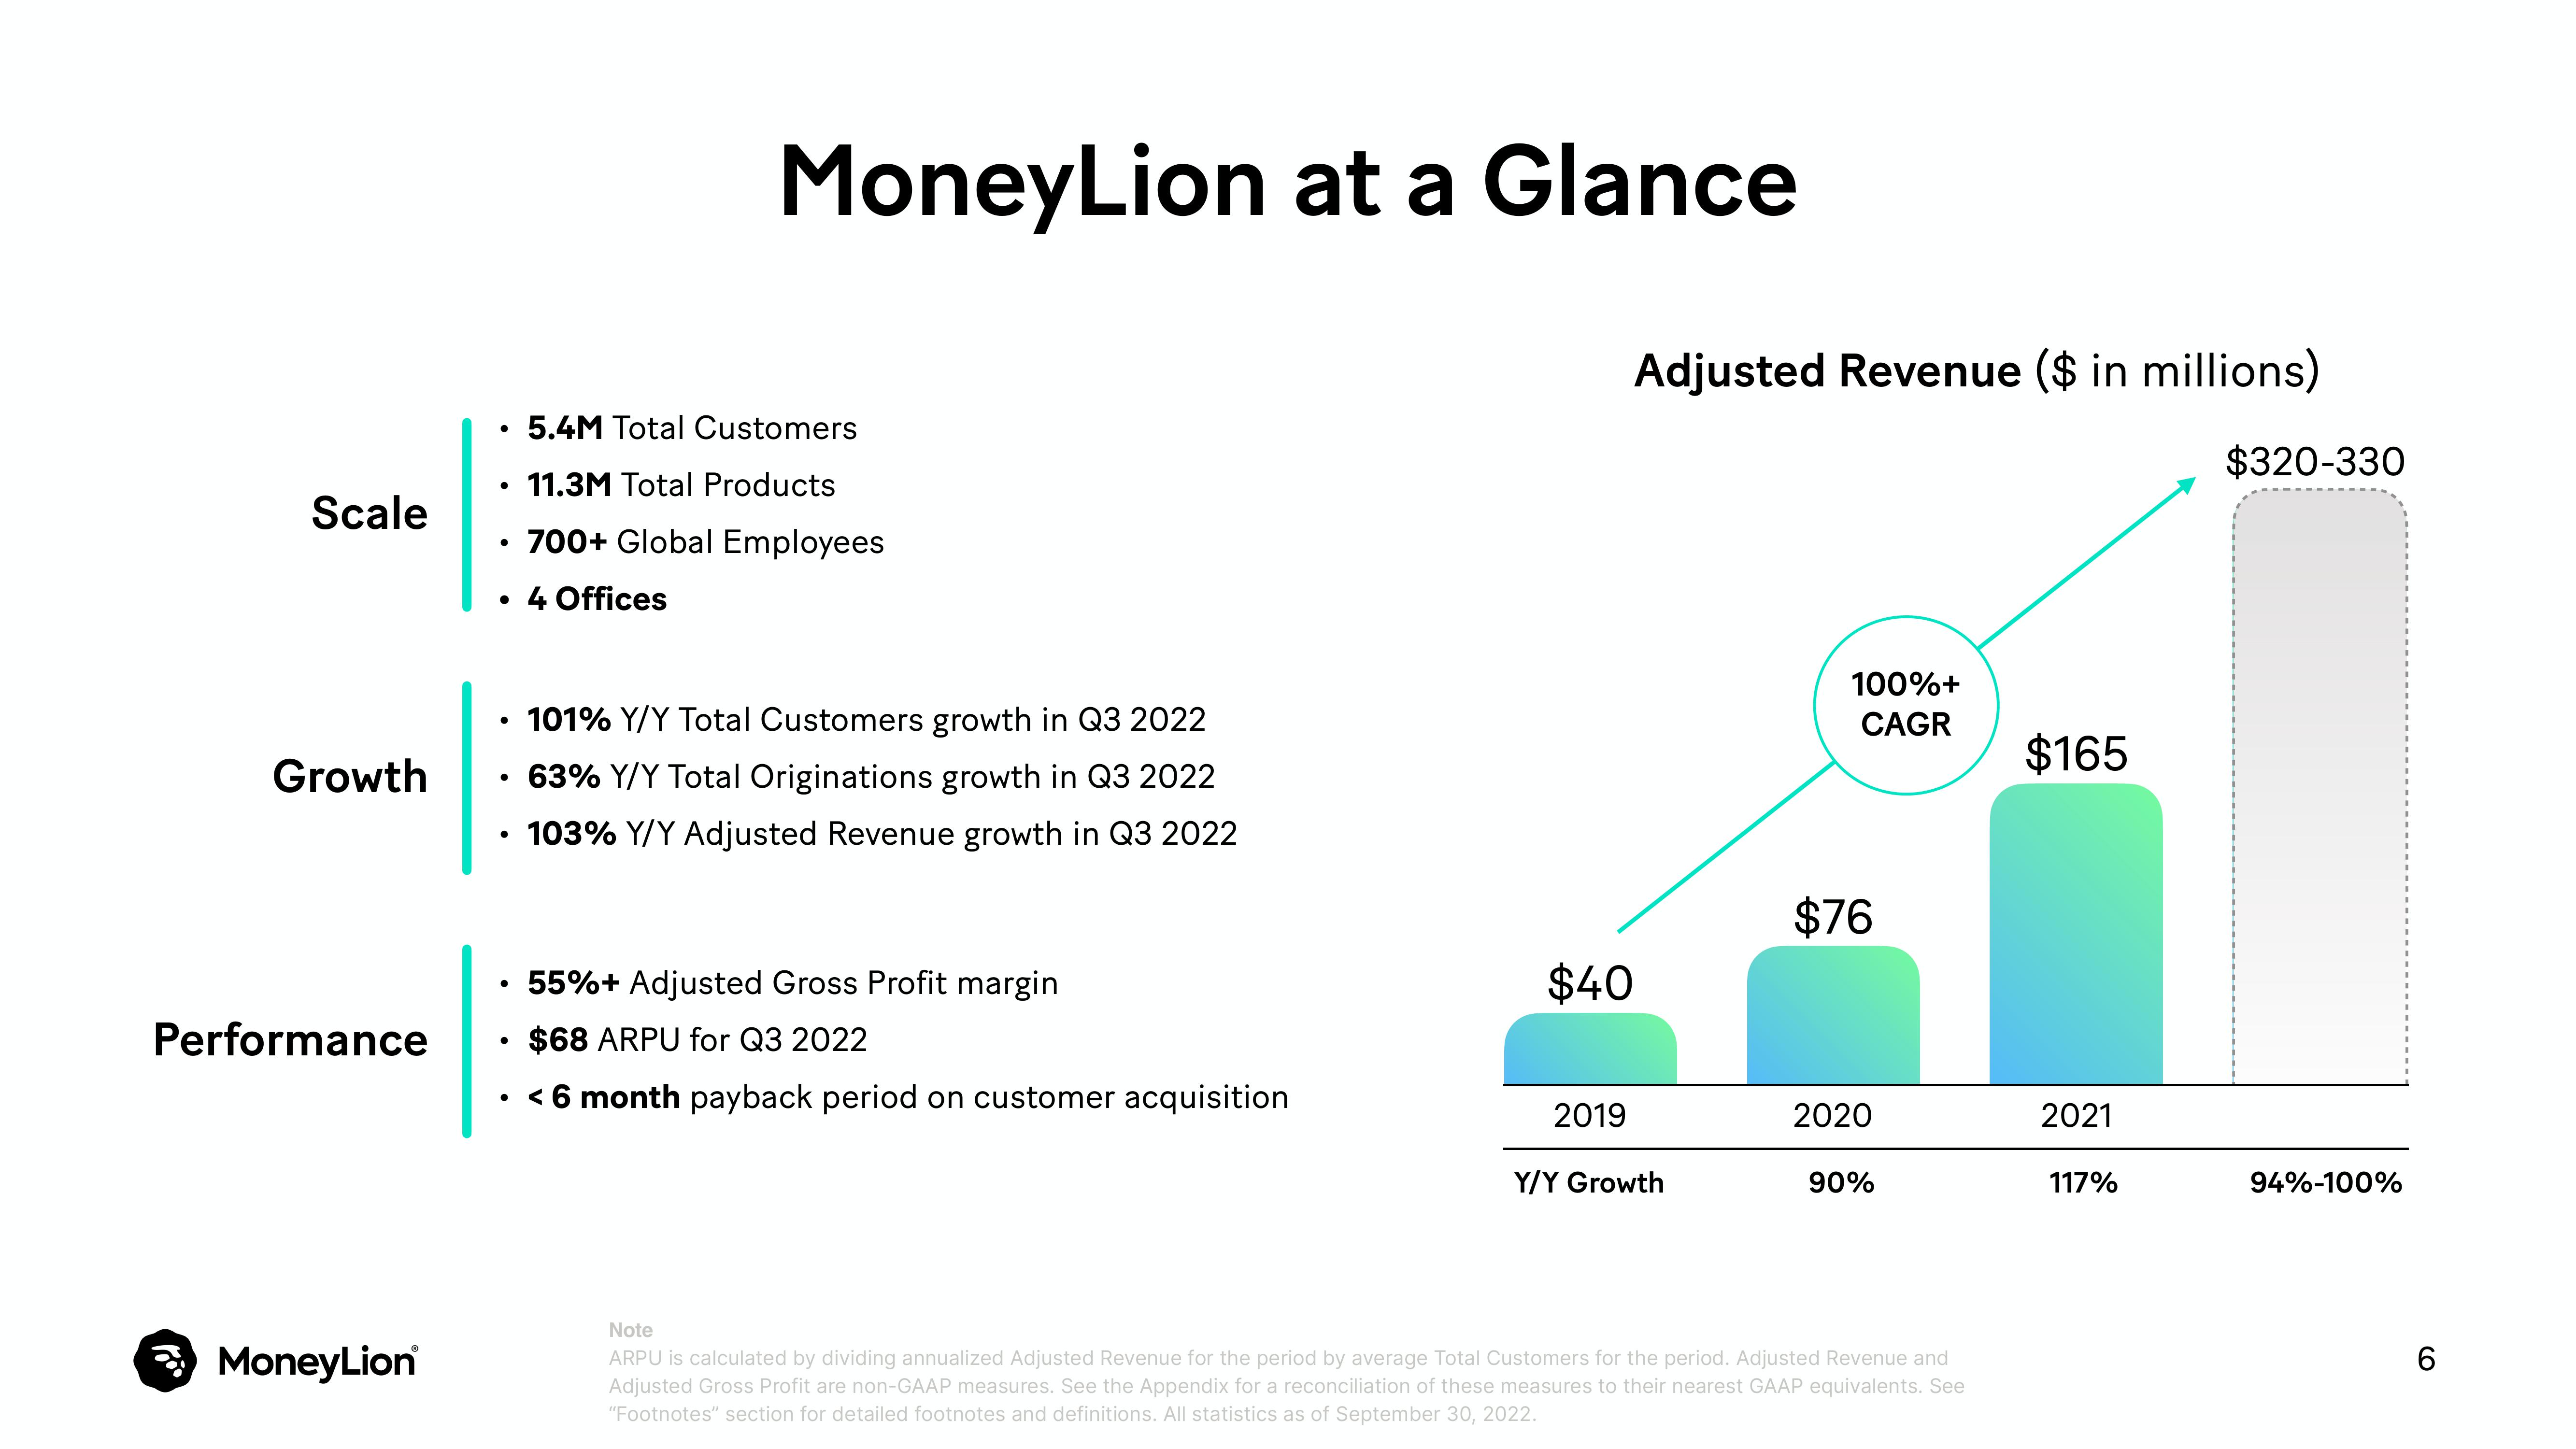
Adjusted Revenue ($ in millions)
$40
2019
Y/Y Growth
100%+
CAGR
$76
2020
90%
Note
ARPU is calculated by dividing annualized Adjusted Revenue for the period by average Total Customers for the period. Adjusted Revenue and
Adjusted Gross Profit are non-GAAP measures. See the Appendix for a reconciliation of these measures to their nearest GAAP equivalents. See
"Footnotes" section for detailed footnotes and definitions. All statistics as of September 30, 2022.
$165
2021
117%
$320-330
94%-100%
6View entire presentation