OpenText Investor Presentation Deck
Strong Cash Flows and Balance Sheet
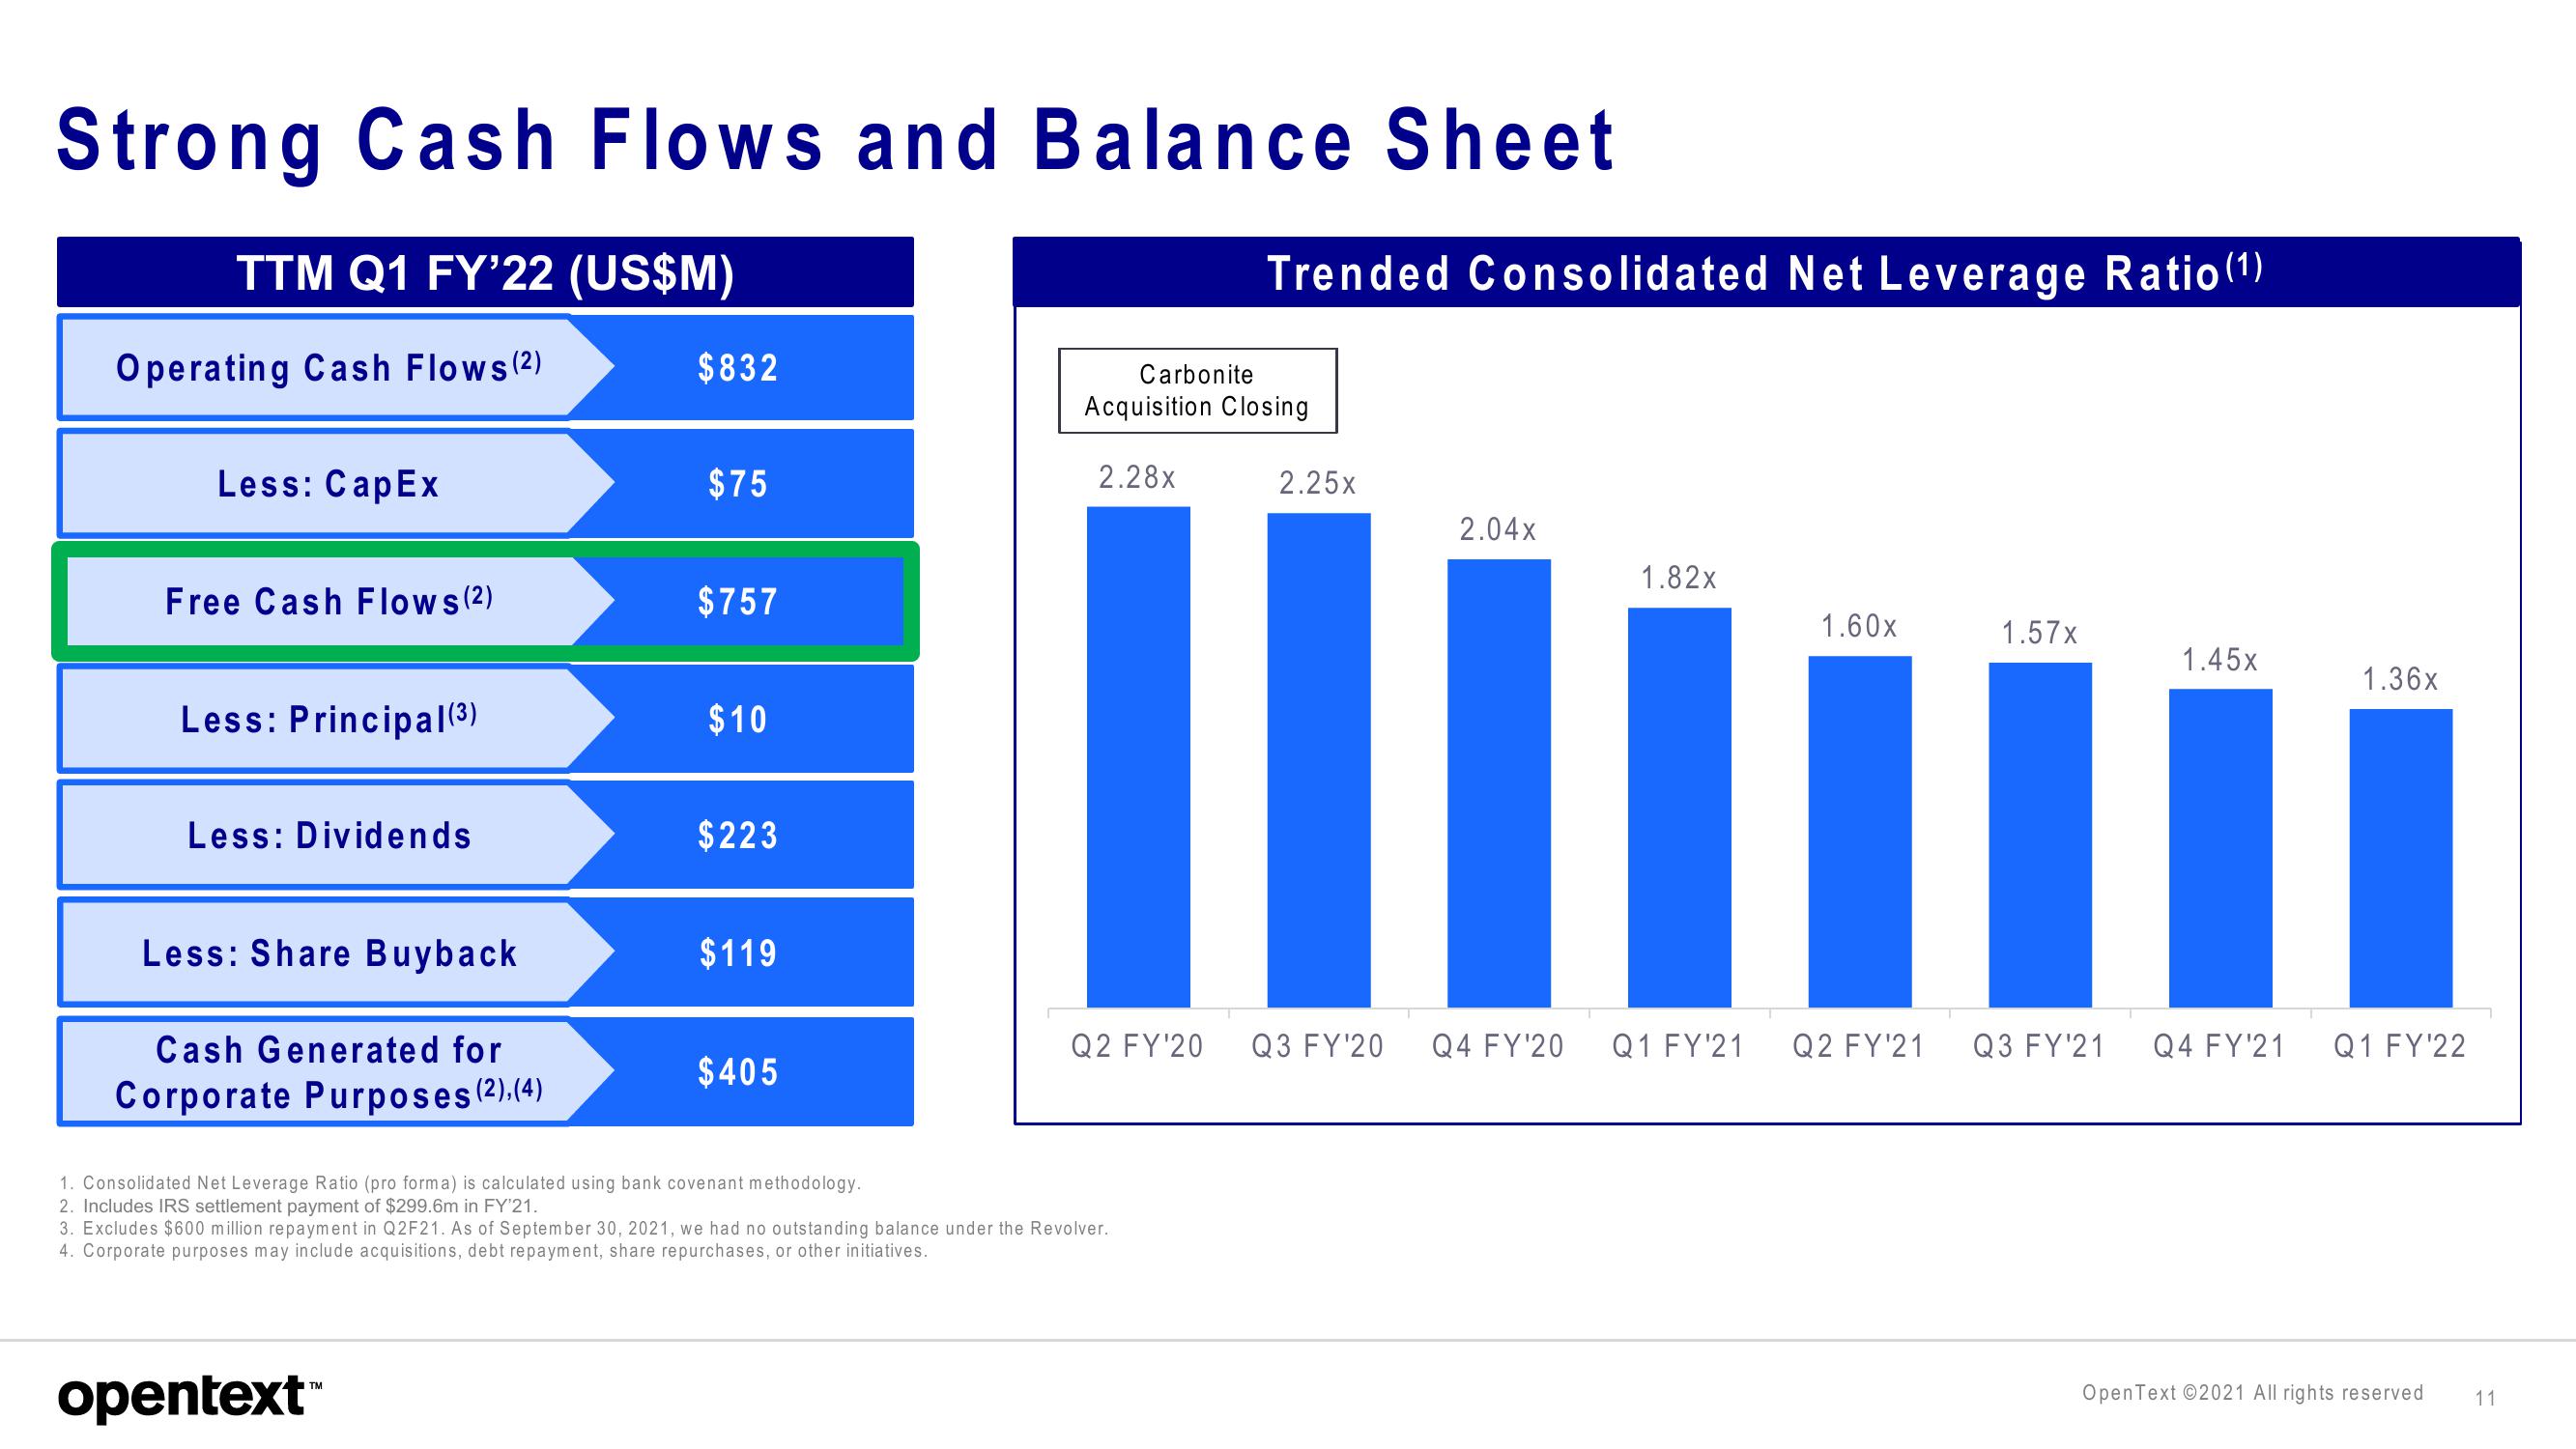
TTM Q1 FY'22 (US$M)
Operating Cash Flows (2)
Less: CapEx
Free Cash Flows (2)
Less: Principal(³)
Less: Dividends
Less: Share Buyback
Cash Generated for
Corporate Purposes (2).(4)
$832
opentext™
$75
$757
$10
$223
$119
$405
Carbonite
Acquisition Closing
2.28x
Trended Consolidated Net Leverage Ratio (1)
1. Consolidated Net Leverage Ratio (pro forma) is calculated using bank covenant methodology.
2. Includes IRS settlement payment of $299.6m in FY'21.
3. Excludes $600 million repayment in Q2F21. As of September 30, 2021, we had no outstanding balance under the Revolver.
4. Corporate purposes may include acquisitions, debt repayment, share repurchases, or other initiatives.
2.25x
2.04x
1.82x
1.60x
Q2 FY'20 Q3 FY'20 Q4 FY'20 Q1 FY'21 Q2 FY¹21
1.57x
1.45x
1.36x
Q3 FY¹21 Q4 FY'21 Q1 FY'22
OpenText ©2021 All rights reserved
11View entire presentation