Nikola SPAC Presentation Deck
FCEV LEASE P&L RECOGNITION
AND CASH FLOW TIMING
TIMING OF FCEV LEASE P&L RECOGNITION AND CASH FLOW
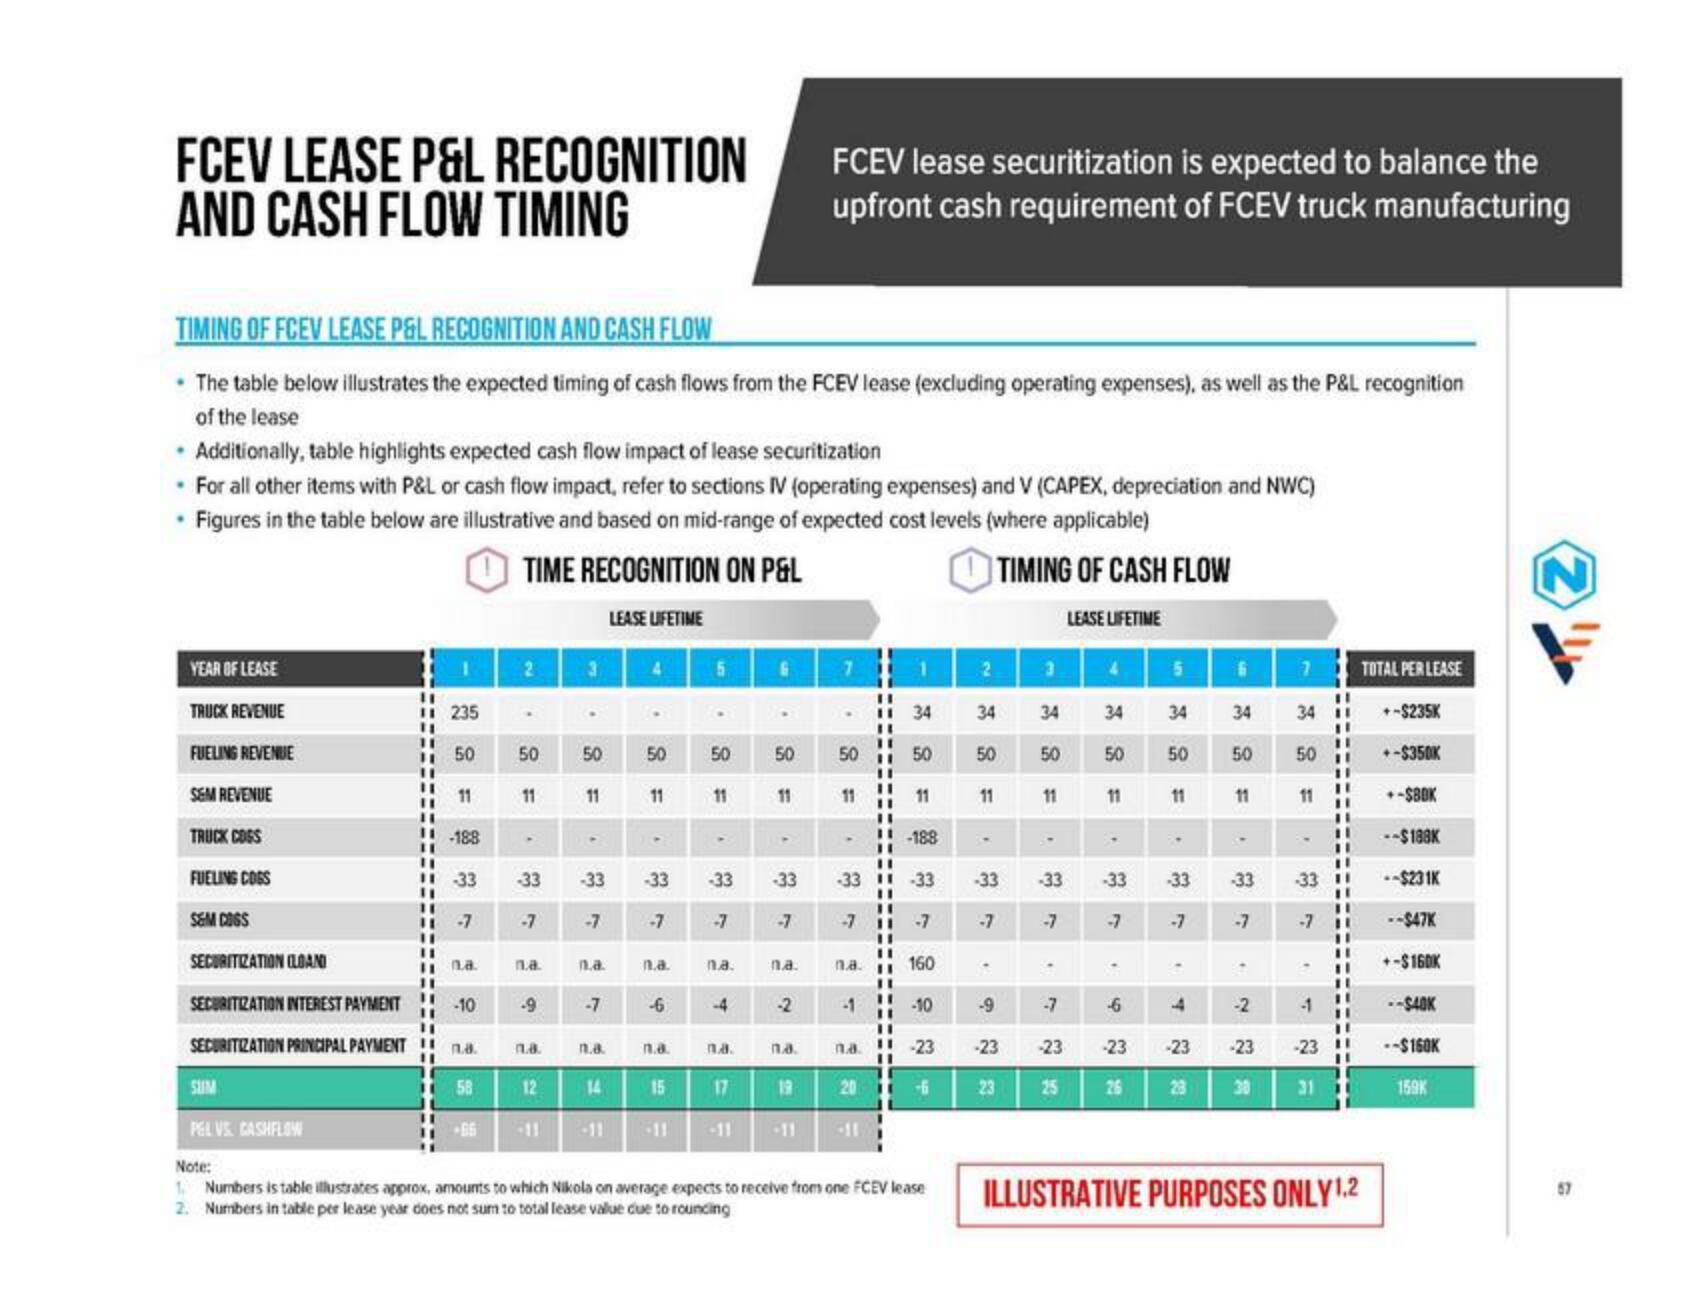
• The table below illustrates the expected timing of cash flows from the FCEV lease (excluding operating expenses), as well as the P&L recognition
of the lease
• Additionally, table highlights expected cash flow impact of lease securitization
• For all other items with P&L or cash flow impact, refer to sections IV (operating expenses) and V (CAPEX, depreciation and NWC)
• Figures in the table below are illustrative and based on mid-range of expected cost levels (where applicable)
TIME RECOGNITION ON P&L
TIMING OF CASH FLOW
LEASE LIFETIME
LEASE LIFETIME
YEAR OF LEASE
TRUCK REVENUE
FUELING REVENUE
SEM REVENUE
TRUCK COGS
FUELING COSS
S&M COGS
SECURITIZATION (LOAN
SECURITIZATION INTEREST PAYMENT
SECURITIZATION PRINCIPAL PAYMENT
SUM
PEL VS CASHFLOW
11
1
235
50
11
-188
11 33
11 na
-10
n.a.
58
+66
2 3
50
11
-33
-7
na.
-9
1.a.
12
50
11
-33
-7
n.a.
-7
n.a.
14
-11
50
11
-33
-7
n.a.
-6
n.a.
15
5
50
11
-33
-7
na.
-4
na.
17
50
11
-33
na.
-2
FCEV lease securitization is expected to balance the
upfront cash requirement of FCEV truck manufacturing
na.
19
50
11
-7
na.
-1
n.a.
1
-3311-33
20
34
50
11
-188
160
-10
-23
-fi
Note:
1. Numbers is table illustrates approx, amounts to which Nikola on average expects to receive from one FCEV lease
2. Numbers in table per lease year does not sum to total lease value due to rouncing
2
34
50
11
-
-33
-9
-23
23
3
34
34
50 50
11
-
-33
-7
-23
4
25
11
.
-33
-6
-23
26
5
34
50
11
.
-33
-
4
-23
23
6
34
50
11
▼
-33
-2
-23
30
7 TOTAL PER LEASE
11
34 11
11
11
50
11
-33 11
-1
11
"1
-7 11
11
-23
11
31
ILLUSTRATIVE PURPOSES ONLY 1.2
+-$235K
+-$350K
+-$80K
--$188K
--$231K
--$47K
+-$160K
--$40K
--$160K
159K
N
57View entire presentation