Ashtead Group Results Presentation Deck
US CONSTRUCTION OUTLOOK
300
250
200
150
100
50
2005
2009
2011
2007
Source: Dodge Data & Analytics (August 2022)
190
170
150
130
110
90
Dodge construction starts
Indexed: 2000=100
70
2013
50
2002 2004 2006 2008
Source: Dodge Data & Analytics (August 2022)
15
First quarter results | 31 July 2022
2015
2010
سر
2017
2012
mm...
Dodge momentum index
Indexed: 2000=100, seasonally adjusted
2019
2014
2021
mmwmp
2016
2018
2023
2020
2025
W
2022
2020
Construction put in place ($bn)
Non-residential
I
2021
540
515
293
291
833
806
637 782
1,470 1,588
+6% +8%
2022
2023
2024 2025
595
702
733
364
289
342
1,044 1,097
660
313
884 973
842 952 1,050 1,088
1,726
2,185
+9%
+4%
1,925 2,094
+12% +9%
Non-building
Construction (excl. resi)
Residential
Construction (total)
Construction growth
Rental market ($bn)
Rental¹
46
50
56
Rental growth
-9%
+9% +11%
Source: Dodge Data & Analytics (June 2022) / IHS Markit (August 2022)
1 Excluding party and event
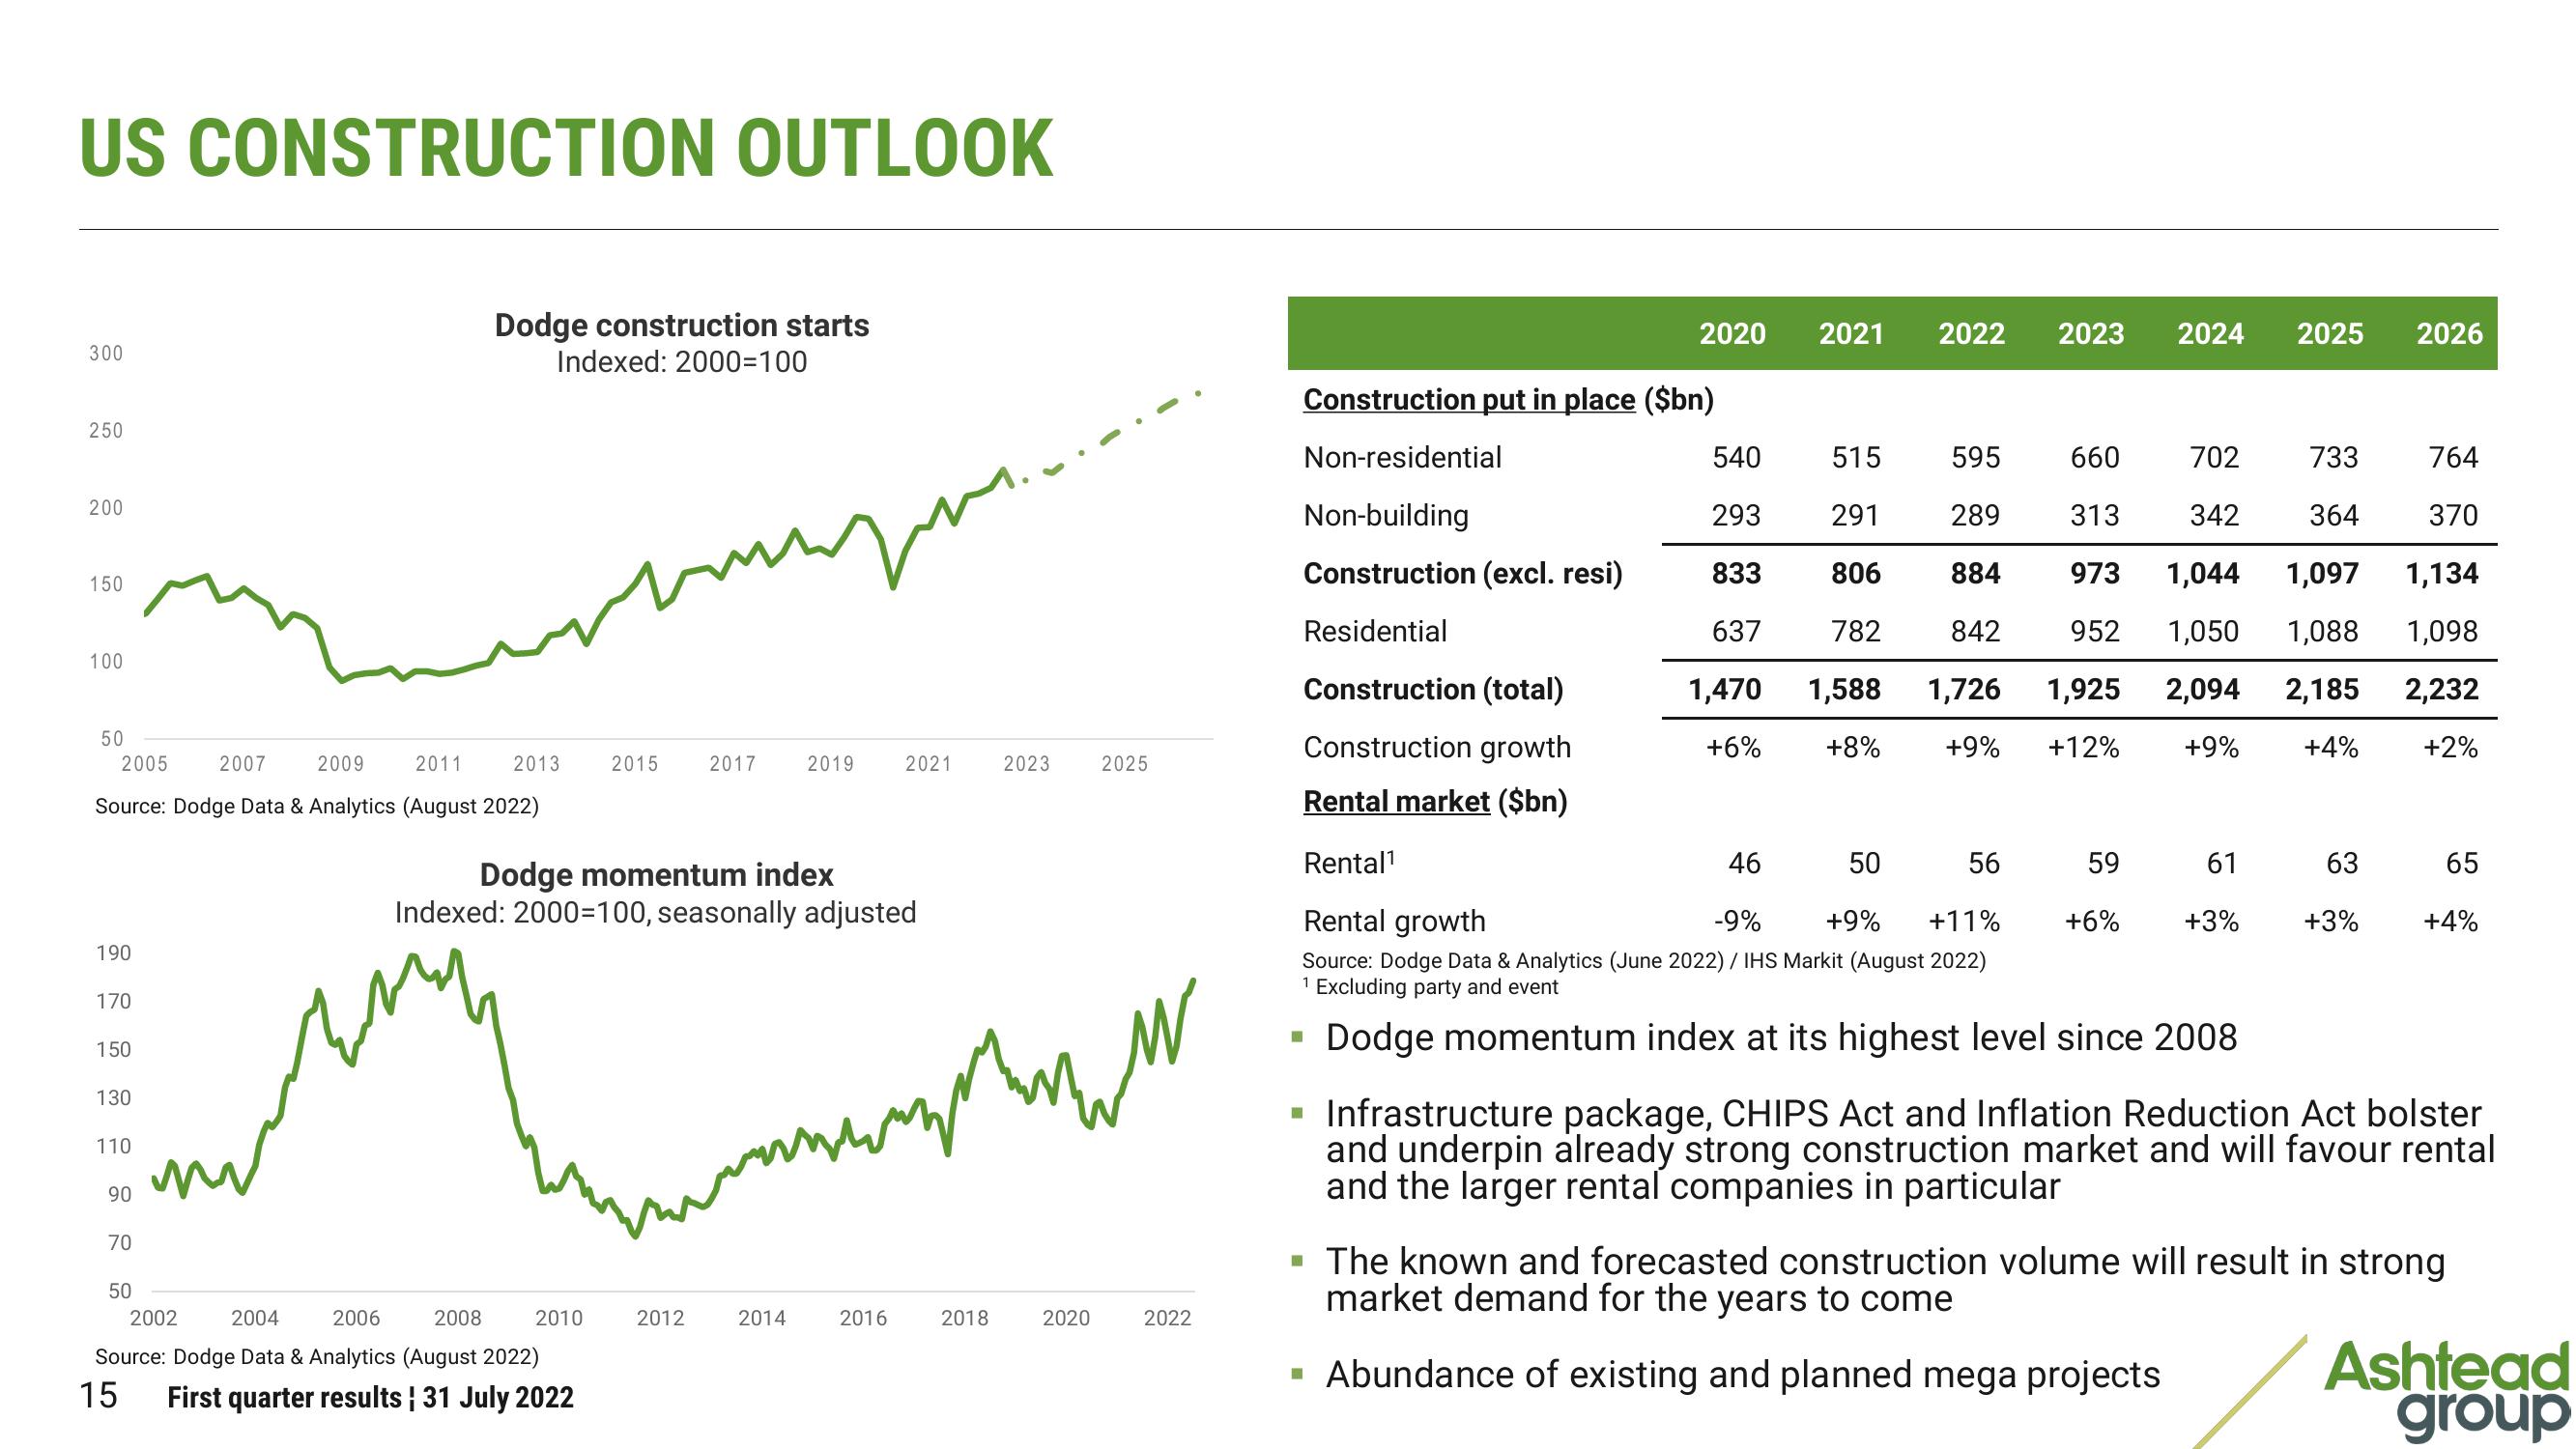
Dodge momentum index at its highest level since 2008
59
61
+6% +3%
63
+3%
2026
764
370
1,134
1,098
2,232
+2%
65
+4%
▪ Infrastructure package, CHIPS Act and Inflation Reduction Act bolster
and underpin already strong construction market and will favour rental
and the larger rental companies in particular
▪ The known and forecasted construction volume will result in strong
market demand for the years to come
■ Abundance of existing and planned mega projects
Ashtead
groupView entire presentation