Marti SPAC Presentation Deck
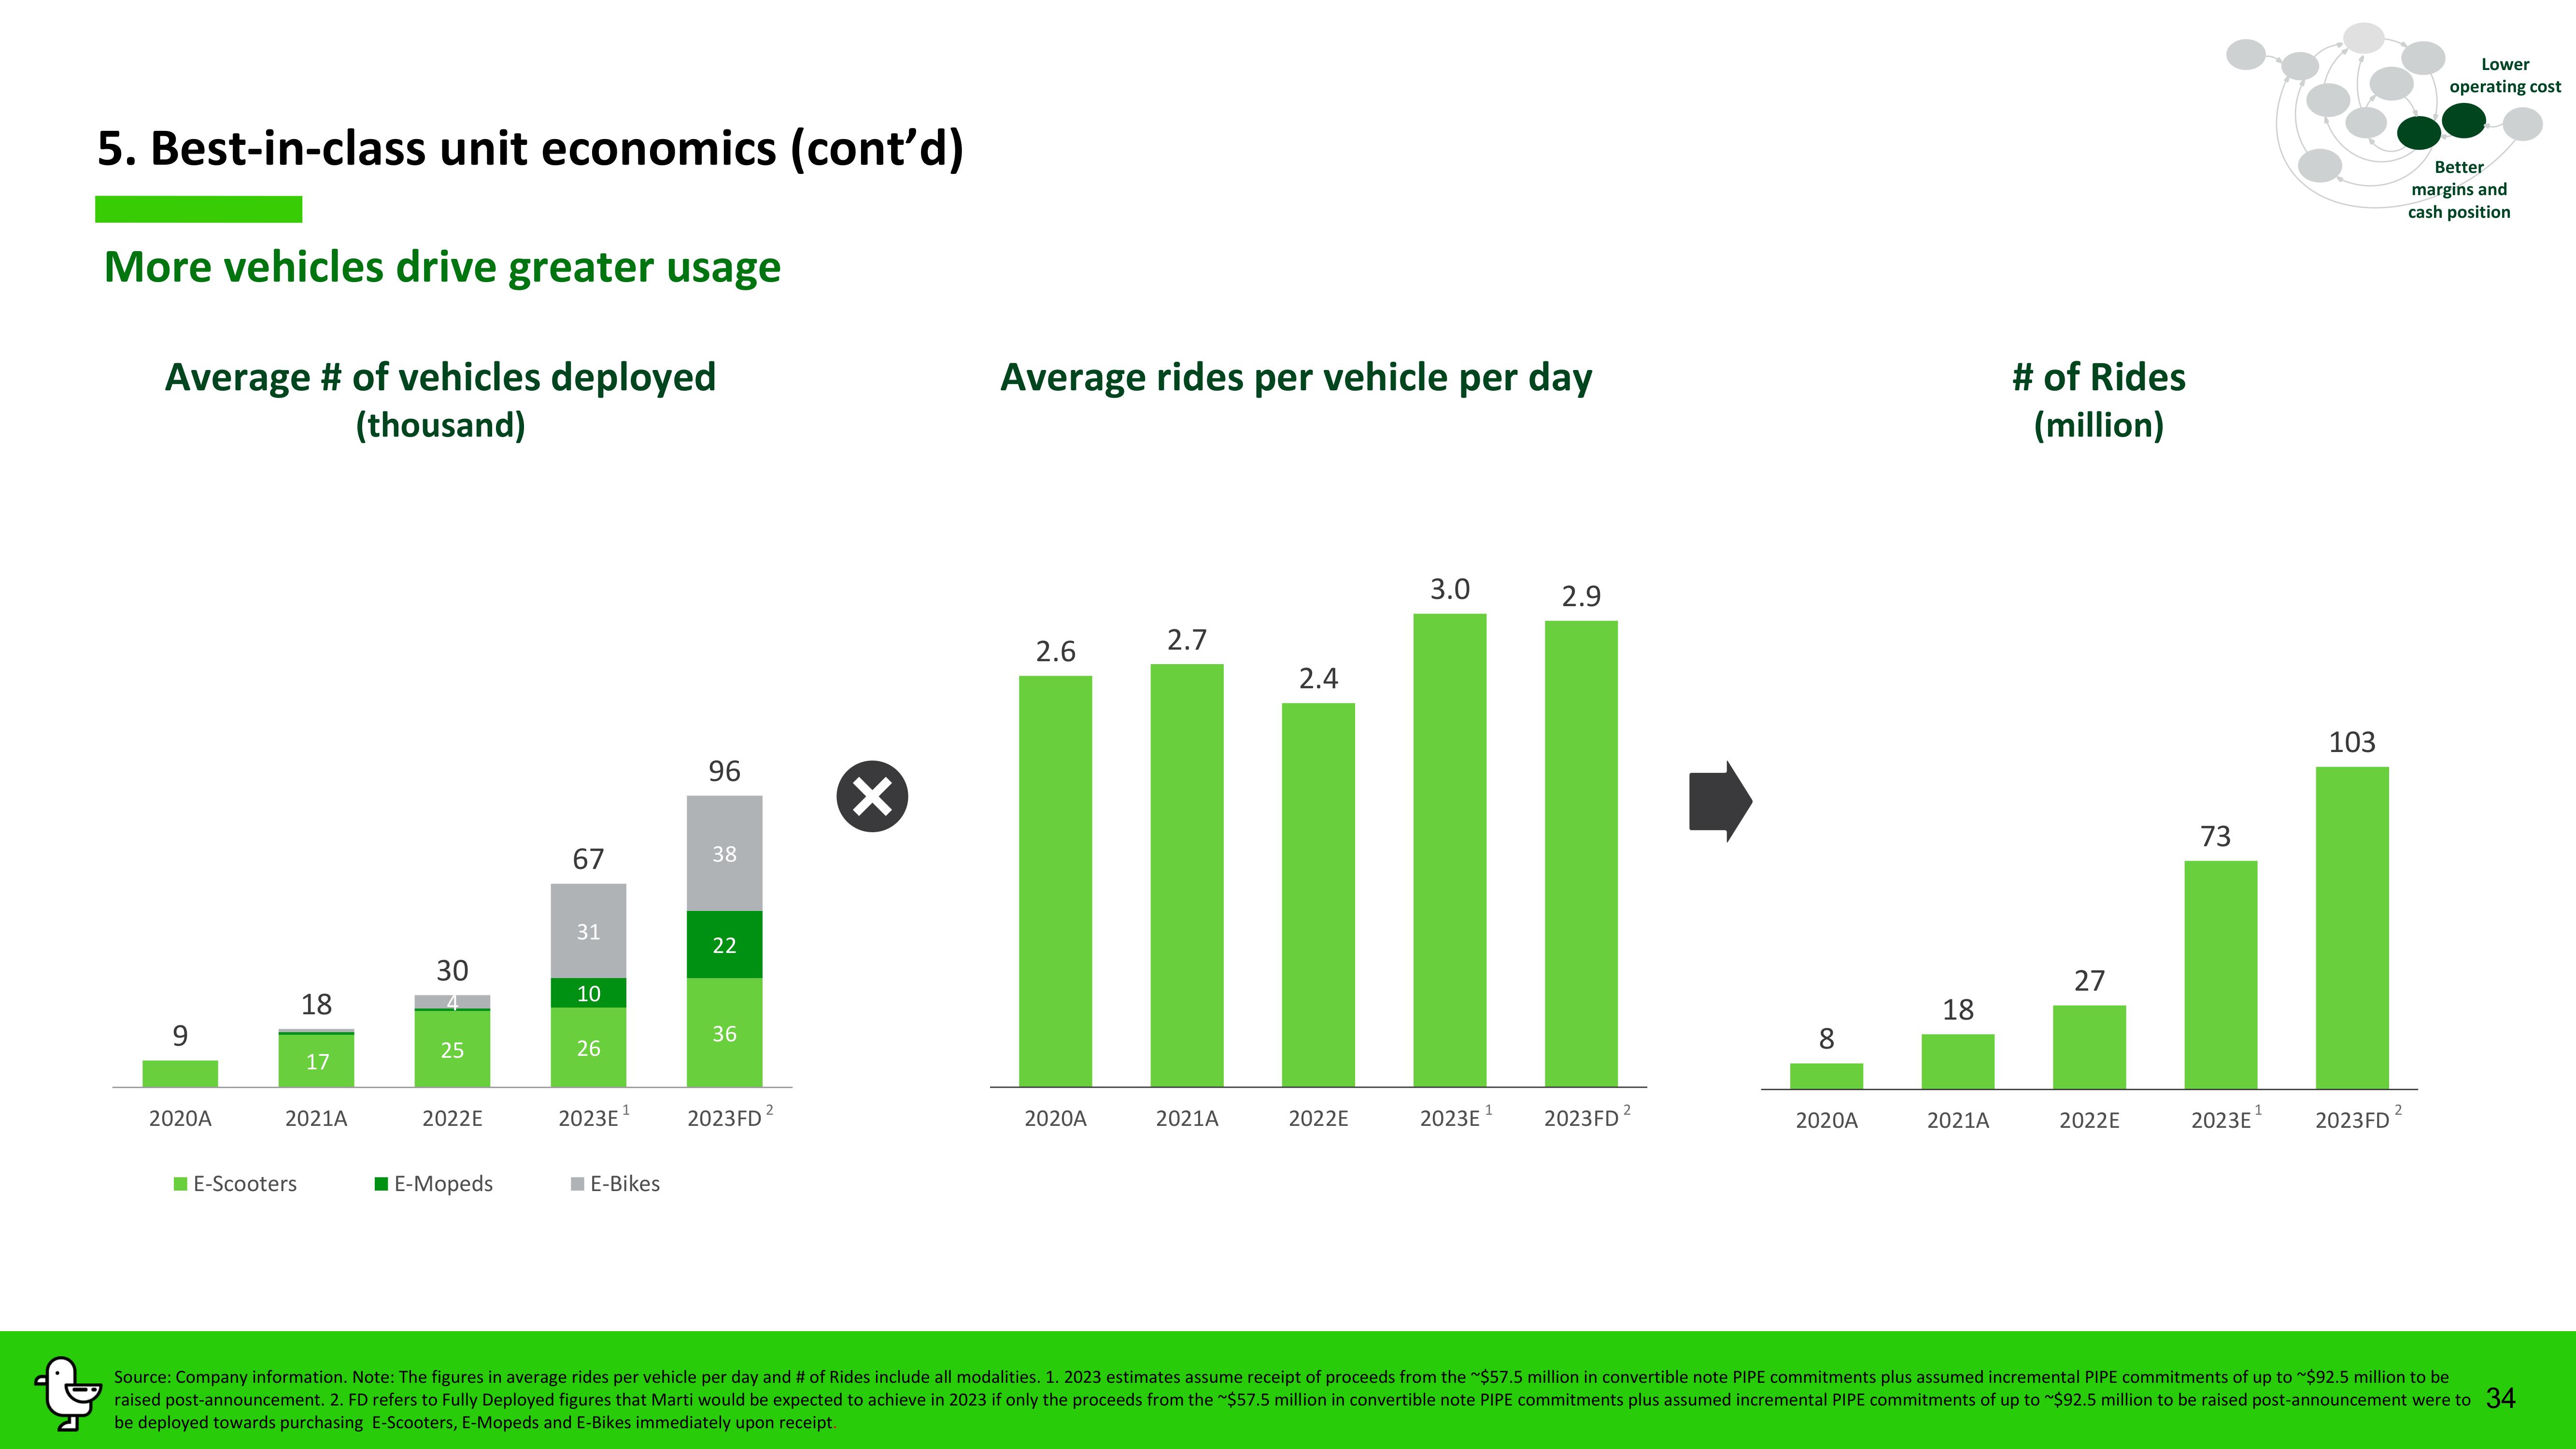
5. Best-in-class unit economics (cont'd)
More vehicles drive greater usage
Average # of vehicles deployed
(thousand)
9
2020A
18
E-Scooters
17
2021A
30
25
2022E
■ E-Mopeds
67
31
10
26
96
E-Bikes
38
22
36
2023E¹ 2023FD2
X
Average rides per vehicle per day
2.6
2020A
2.7
2021A
2.4
2022E
3.0
2023E¹
2.9
2023FD²
8
2020A
18
2021A
# of Rides
(million)
27
2022E
73
2023E
103
2023FD²
Lower
operating cost
Better
margins and
cash position
Source: Company information. Note: The figures in average rides per vehicle per day and # of Rides include all modalities. 1. 2023 estimates assume receipt of proceeds from the ~$57.5 million in convertible note PIPE commitments plus assumed incremental PIPE commitments of up to $92.5 million to be
raised post-announcement. 2. FD refers to Fully Deployed figures that Marti would be expected to achieve in 2023 if only the proceeds from the ~$57.5 million in convertible note PIPE commitments plus assumed incremental PIPE commitments of up to $92.5 million to be raised post-announcement were to 34
be deployed towards purchasing E-Scooters, E-Mopeds and E-Bikes immediately upon receipt.View entire presentation