Paysafe Results Presentation Deck
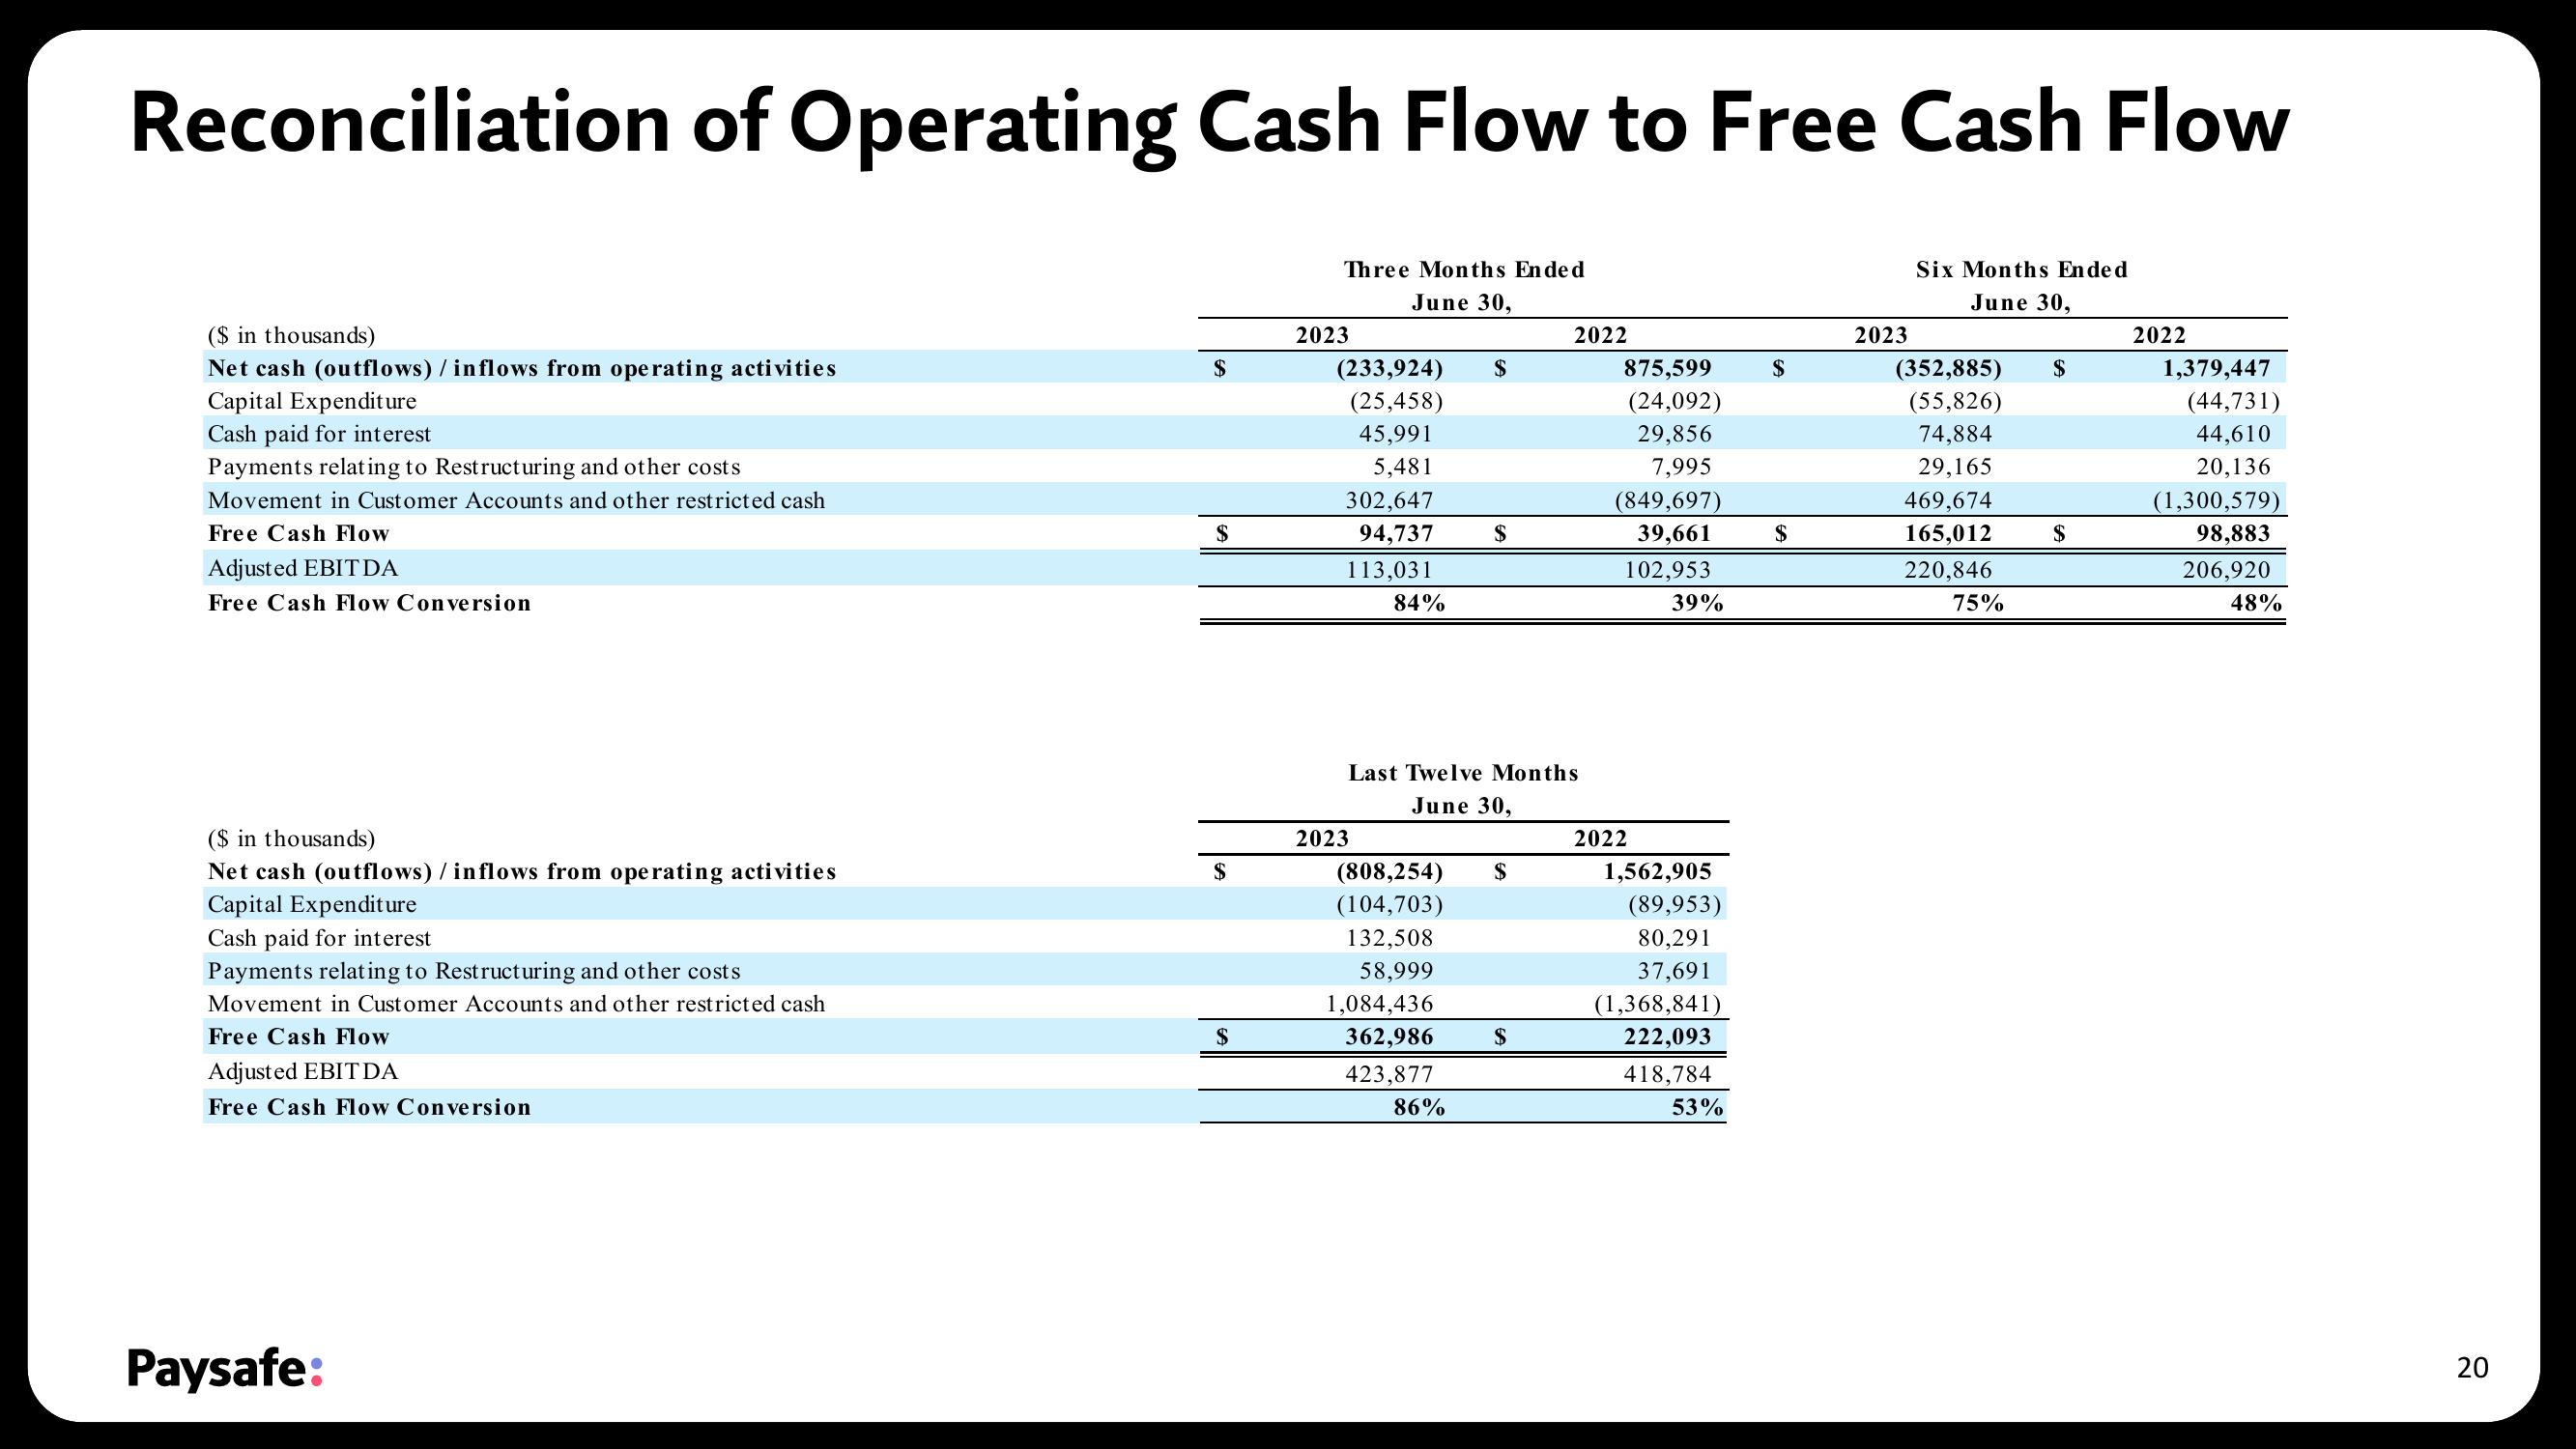
Reconciliation of Operating Cash Flow to Free Cash Flow
Six Months Ended
June 30,
($ in thousands)
Net cash (outflows) / inflows from operating activities
Capital Expenditure
Cash paid for interest
Payments relating to Restructuring and other costs
Movement in Customer Accounts and other restricted cash
Free Cash Flow
Adjusted EBITDA
Free Cash Flow Conversion
($ in thousands)
Net cash (outflows) / inflows from operating activities
Capital Expenditure
Cash paid for interest
Payments relating to Restructuring and other costs
Movement in Customer Accounts and other restricted cash
Free Cash Flow
Adjusted EBITDA
Free Cash Flow Conversion
Paysafe:
$
$
$
$
Three Months Ended
June 30,
2023
(233,924)
(25,458)
45,991
5,481
302,647
94,737
113,031
84%
2023
$
(808,254)
(104,703)
132,508
58,999
1,084,436
362,986
423,877
86%
S
Last Twelve Months
June 30,
$
2022
$
875,599
(24,092)
29,856
7,995
(849,697)
39,661
102,953
39%
2022
1,562,905
(89,953)
80,291
37,691
(1,368,841)
222,093
418,784
53%
$
$
2023
(352,885)
(55,826)
74,884
29,165
469,674
165,012
220,846
75%
$
$
2022
1,379,447
(44,731)
44,610
20,136
(1,300,579)
98,883
206,920
48%
20View entire presentation