First Quarter 2017 Financial Review
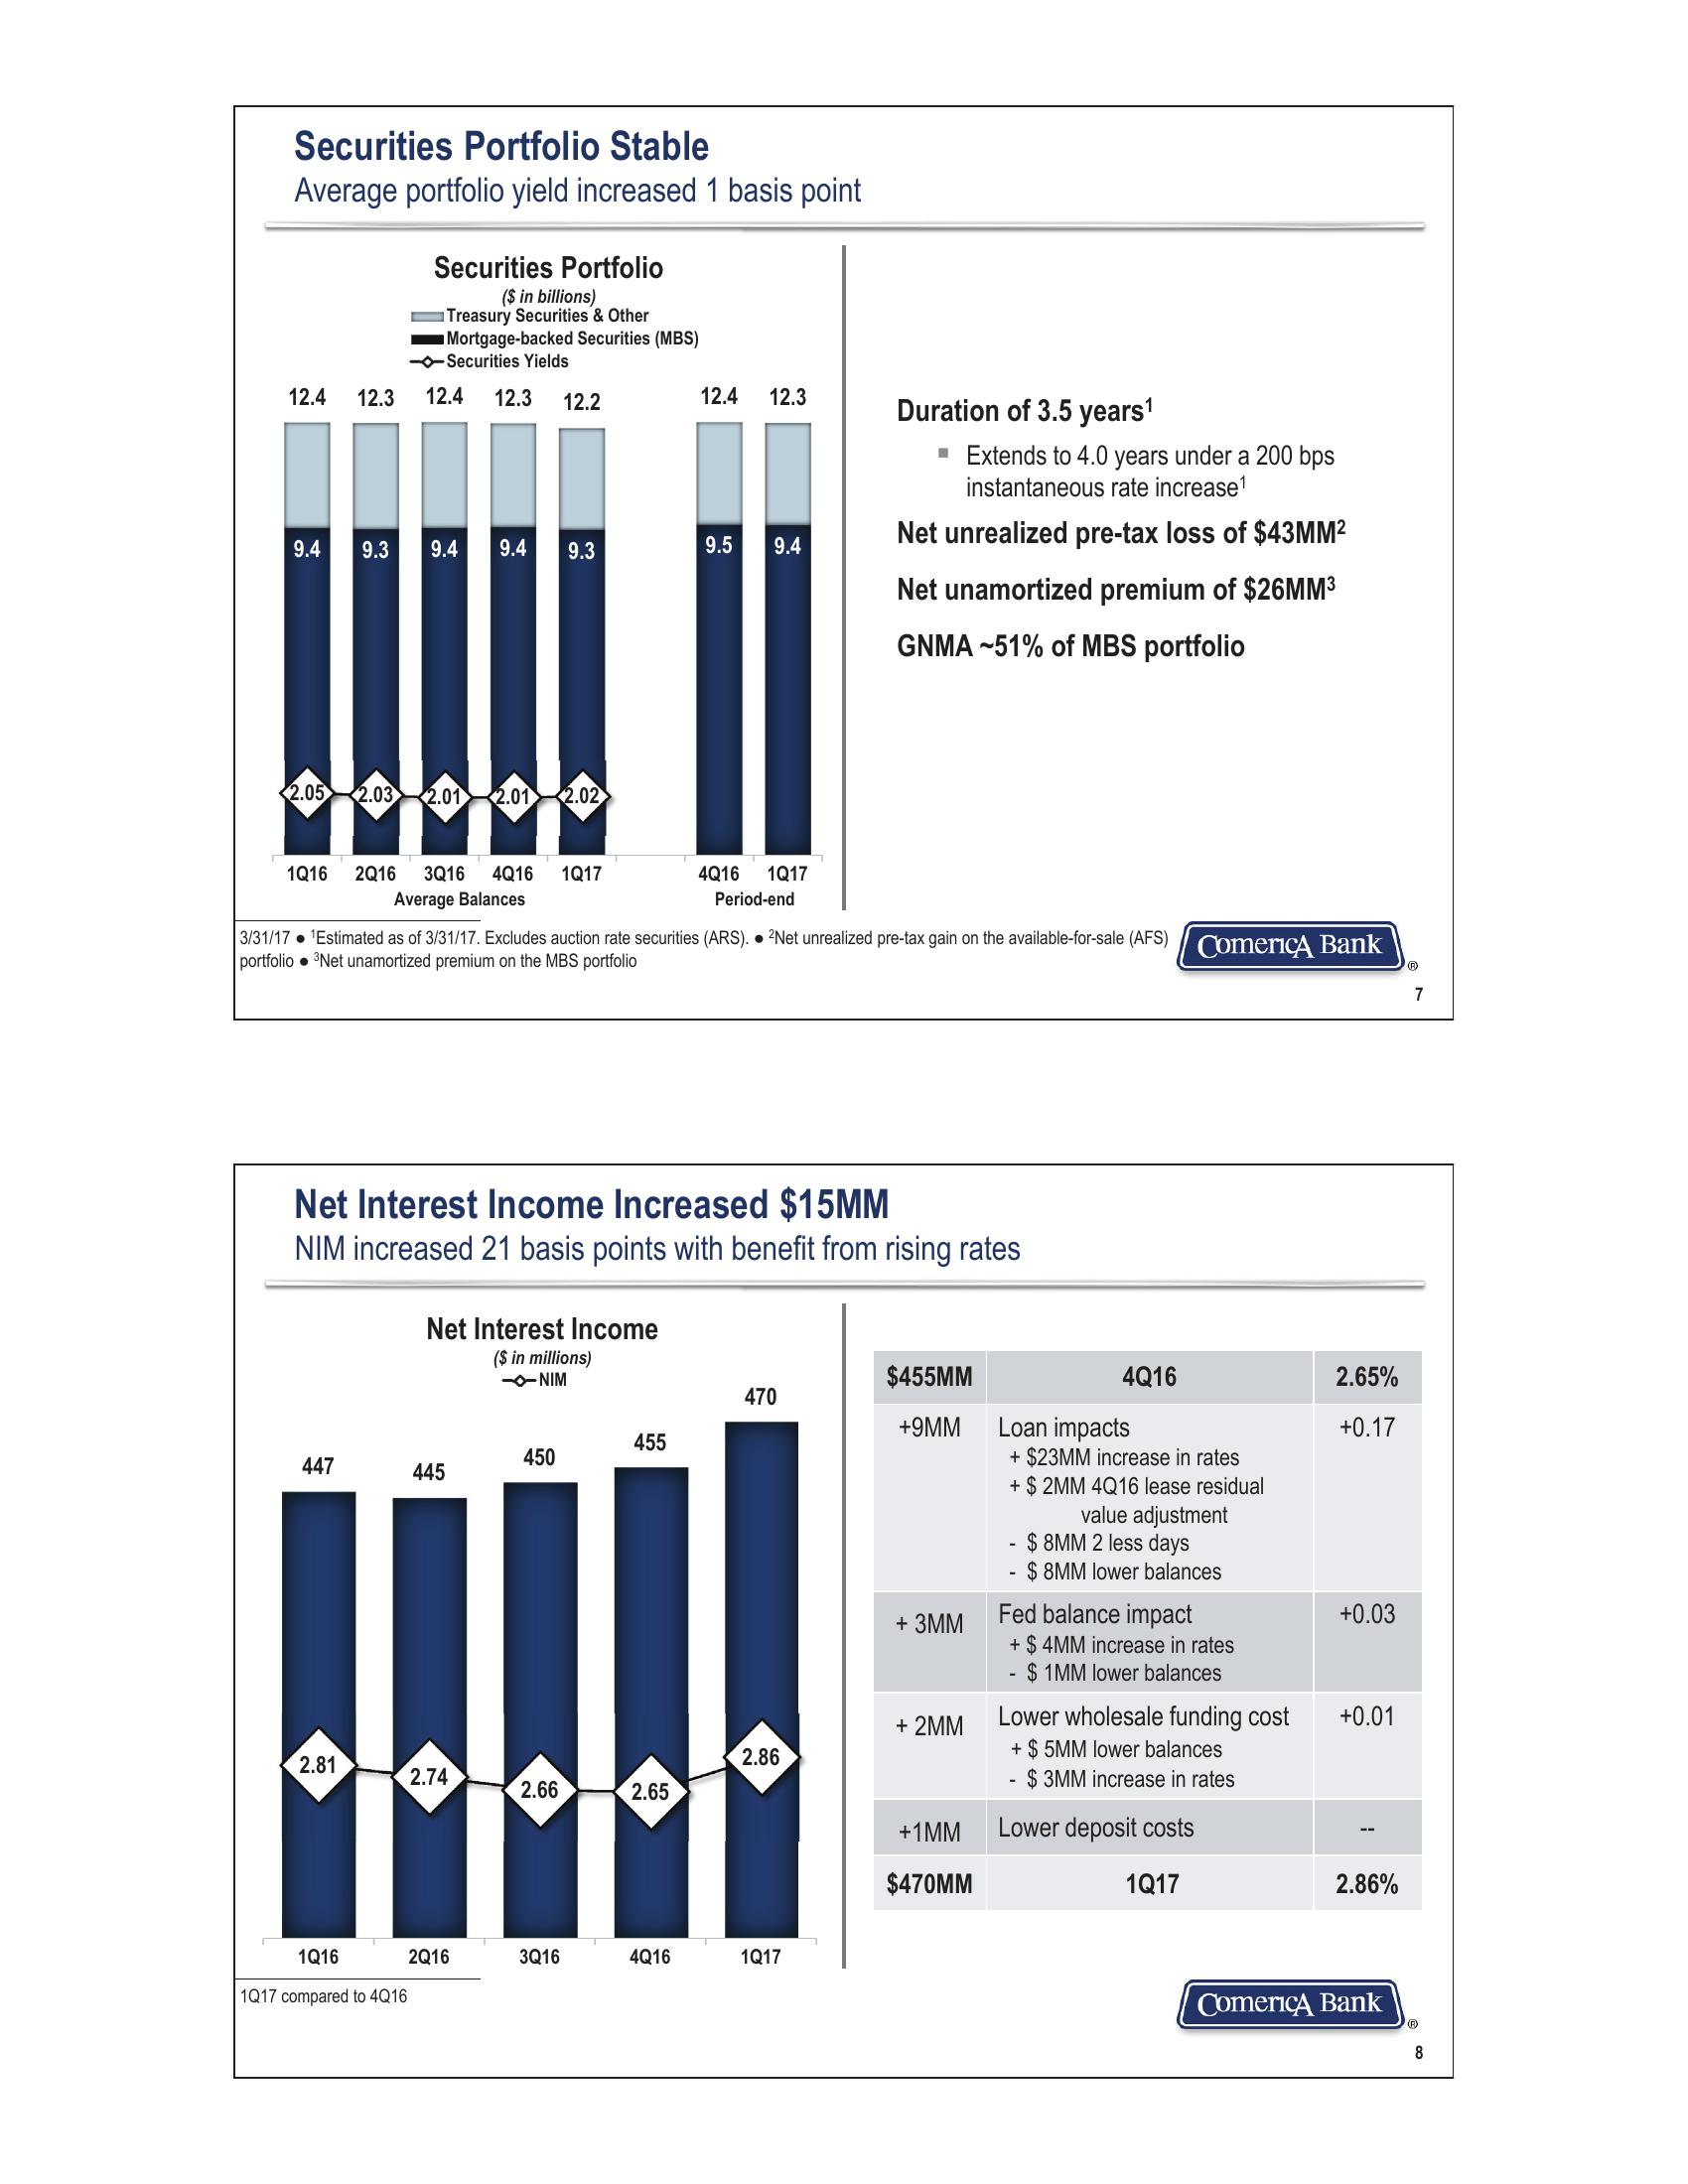
Securities Portfolio Stable
Average portfolio yield increased 1 basis point
Securities Portfolio
($ in billions)
Treasury Securities & Other
Mortgage-backed Securities (MBS)
-Securities Yields
12.4 12.3 12.4 12.3 12.2
12.4 12.3
Duration of 3.5 years¹
9.4
9.3 9.4 9.4 9.3
9.5
9.4
2.05
2.03
2.01 2.01
2.02
1Q16 2Q16
3Q16 4Q16
Average Balances
1Q17
4Q16
1Q17
Period-end
■ Extends to 4.0 years under a 200 bps
instantaneous rate increase1
Net unrealized pre-tax loss of $43MM²
Net unamortized premium of $26MM³
GNMA-51% of MBS portfolio
3/31/17 Estimated as of 3/31/17. Excludes auction rate securities (ARS). • 2Net unrealized pre-tax gain on the available-for-sale (AFS) Comerica Bank
portfolio Net unamortized premium on the MBS portfolio
Net Interest Income Increased $15MM
NIM increased 21 basis points with benefit from rising rates
Net Interest Income
($ in millions)
--NIM
$455MM
4Q16
470
+9MM
Loan impacts
455
450
+ $23MM increase in rates
447
445
+ $2MM 4Q16 lease residual
value adjustment
2.65%
+0.17
$8MM 2 less days
$ 8MM lower balances
+ 3MM
Fed balance impact
+0.03
+ $4MM increase in rates
-
$ 1MM lower balances
+ 2MM
Lower wholesale funding cost
+0.01
2.86
+$5MM lower balances
2.81
2.74
$3MM increase in rates
2.66
2.65
+1MM
Lower deposit costs
$470MM
1Q17
2.86%
1Q16
1Q17 compared to 4Q16
2Q16
3Q16
4Q16
1Q17
Ⓡ
7
Comerica Bank
Ⓡ
8View entire presentation