J.P.Morgan Investment Banking
APPENDIX
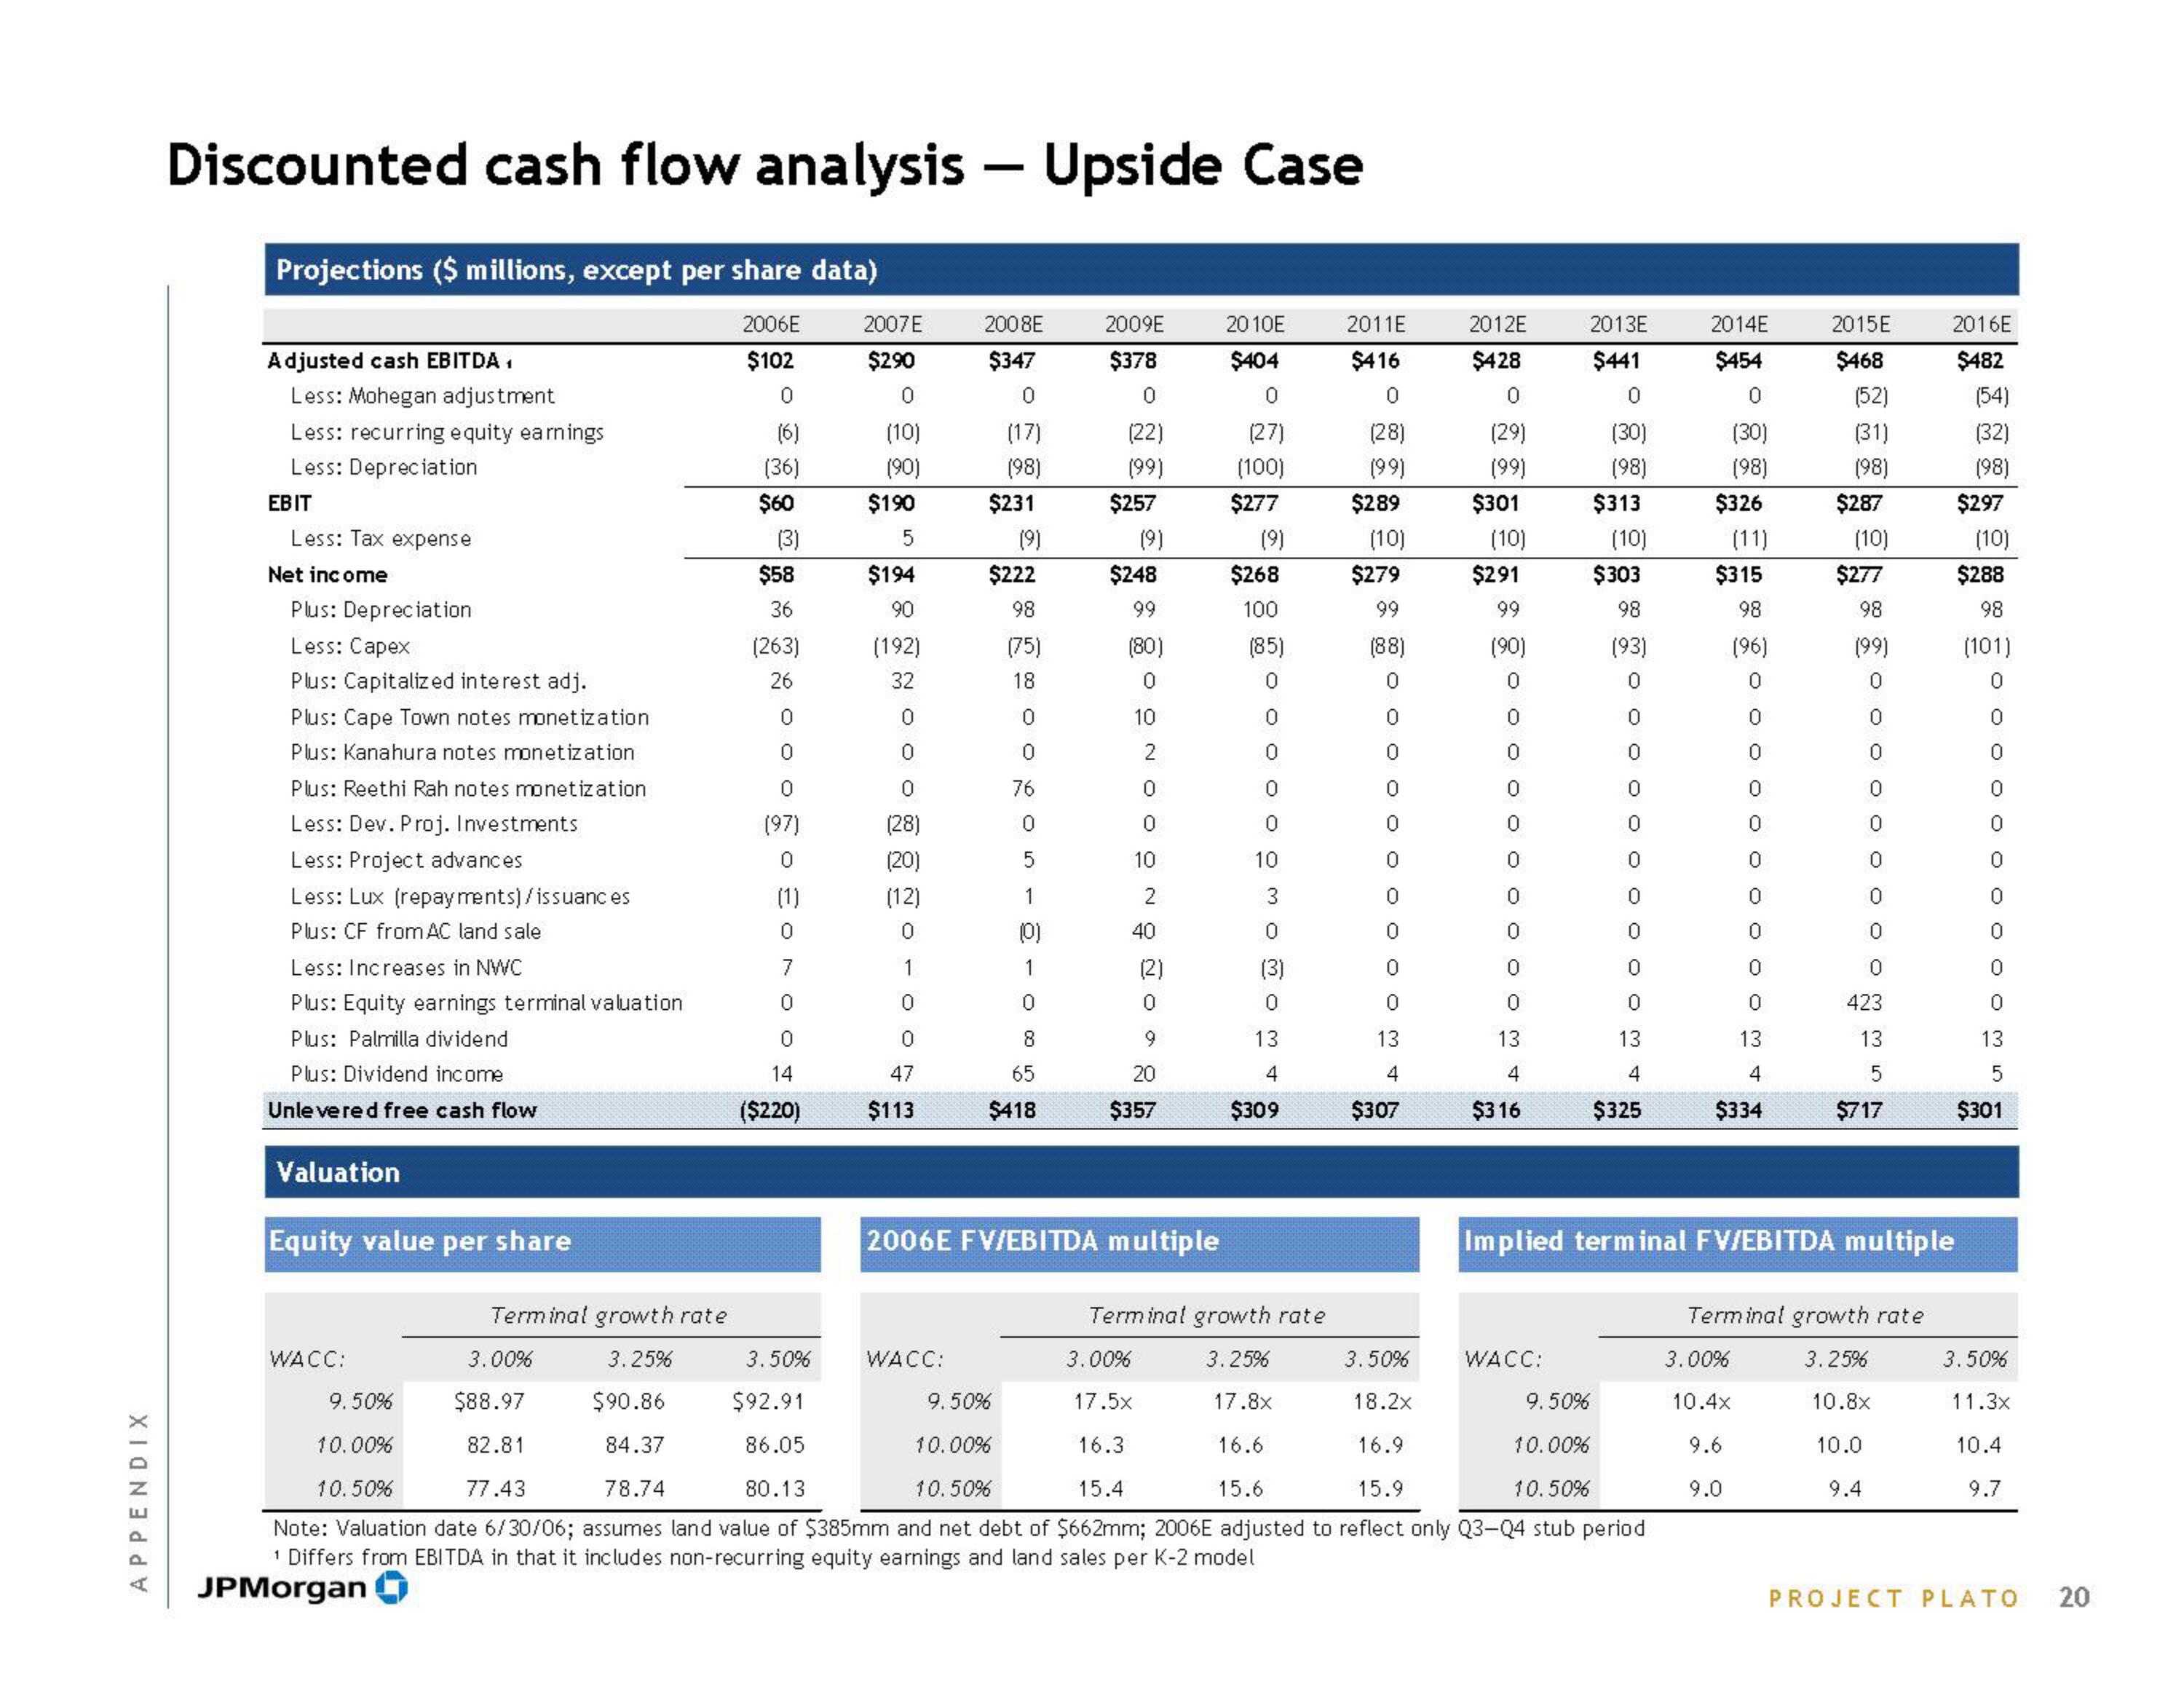
Discounted cash flow analysis - Upside Case
Projections ($ millions, except per share data)
2006E
$102
0
(6)
(36)
Adjusted cash EBITDA,
Less: Mohegan adjustment
Less: recurring equity earnings
Less: Depreciation
EBIT
Less: Tax expense
Net income
Plus: Depreciation
Less: Capex
Plus: Capitalized interest adj.
Plus: Cape Town notes monetization
Plus: Kanahura notes monetization
Plus: Reethi Rah notes monetization
Less: Dev. Proj. Investments
Less: Project advances
Less: Lux (repayments) / issuances
Plus: CF from AC land sale
Less: Increases in NWC
Plus: Equity earnings terminal valuation
Plus: Palmilla dividend
Plus: Dividend income
Unle vered free cash flow
Valuation
Equity value per share
WACC:
$60
(3)
$58
36
(263)
26
0
0
0
(97)
0
3.00%
$88.97
82.81
77.43
(1)
0
7
0
0
14
($220)
2007 E
$290
0
(10)
(90)
$190
5
$194
90
(192)
32
0
0
0
(28)
(20)
(12)
0
1
0
0
47
$113
2008E
$347
0
(17)
(98)
WACC:
$231
(9)
$222
98
(75)
18
0
pogon - 2-000
0
76
0
5
1
(0)
1
8
65
$418
2009E
$378
0
(22)
(99)
$257
(9)
$248
99
(80)
0
10
2
0
0
10
2
40
(2)
0
9
20
$357
2006E FV/EBITDA multiple
2010E
$404
0
(27)
(100)
$277
(9)
$268
100
(85)
0
ܘ ܘ ܘ ܘ ܘ ܚ ܘ ܝ ܘ ܚ
10
13
$309
2011E
$416
0
(28)
(99)
$289
(10)
$279
99
(88)
0
0
0
0
0
0
0
0
0
0
13
4
$307
2012E
$428
0
(29)
(99)
$301
(10)
$291
99
(90)
0
0
0
ooooooom
13
4
$316
Terminal growth rate
Terminal growth rate
3.25%
3.50%
3.00%
3.25%
3.50%
9.50%
$90.86
$92.91
9.50%
17.5x
17.8x
18.2x
9.50%
10.00%
84.37
86.05
10.00%
16.3
16.6
16.9
10.00%
10.50%
78.74
80.13
10.50%
15.4
15.6
15.9
10.50%
Note: Valuation date 6/30/06; assumes land value of $385mm and net debt of $662mm; 2006E adjusted to reflect only Q3-Q4 stub period
¹ Differs from EBITDA in that it includes non-recurring equity earnings and land sales per K-2 model
JPMorgan
2013E
$441
0
(30)
(98)
$313
(10)
$303
98
(93)
0
0
0
0
0
0
0
0
0
0
13
4
$325
g
WACC:
2014E
$454
0
(30)
(98)
$326
(11)
$315
98
(96)
0
0
0
0
0
0
0
0
0
0
13
4
$334
2015E
$468
(52)
(31)
(98)
3.00%
10.4x
9.6
9.0
$287
(10)
$277
98
(99)
0
0
0
0
0
0
0
0
0
423
13
5
$717
Implied terminal FV/EBITDA multiple
Terminal growth rate
3.25%
2016E
$482
(54)
(32)
(98)
10.8x
10.0
9.4
$297
(10)
$288
98
(101)
0
O O O O O O O OOMS
13
$301
3.50%
11.3x
10.4
9.7
PROJECT PLATO 20View entire presentation