XP Inc Results Presentation Deck
Adjusted EBITDA and Margin
Operational Leverage despite investments in technology, client experience and product offering
Adjusted EBITDA (in R$ mn)
595
■
1Q20
+75%
1,043
1Q21
Highlights
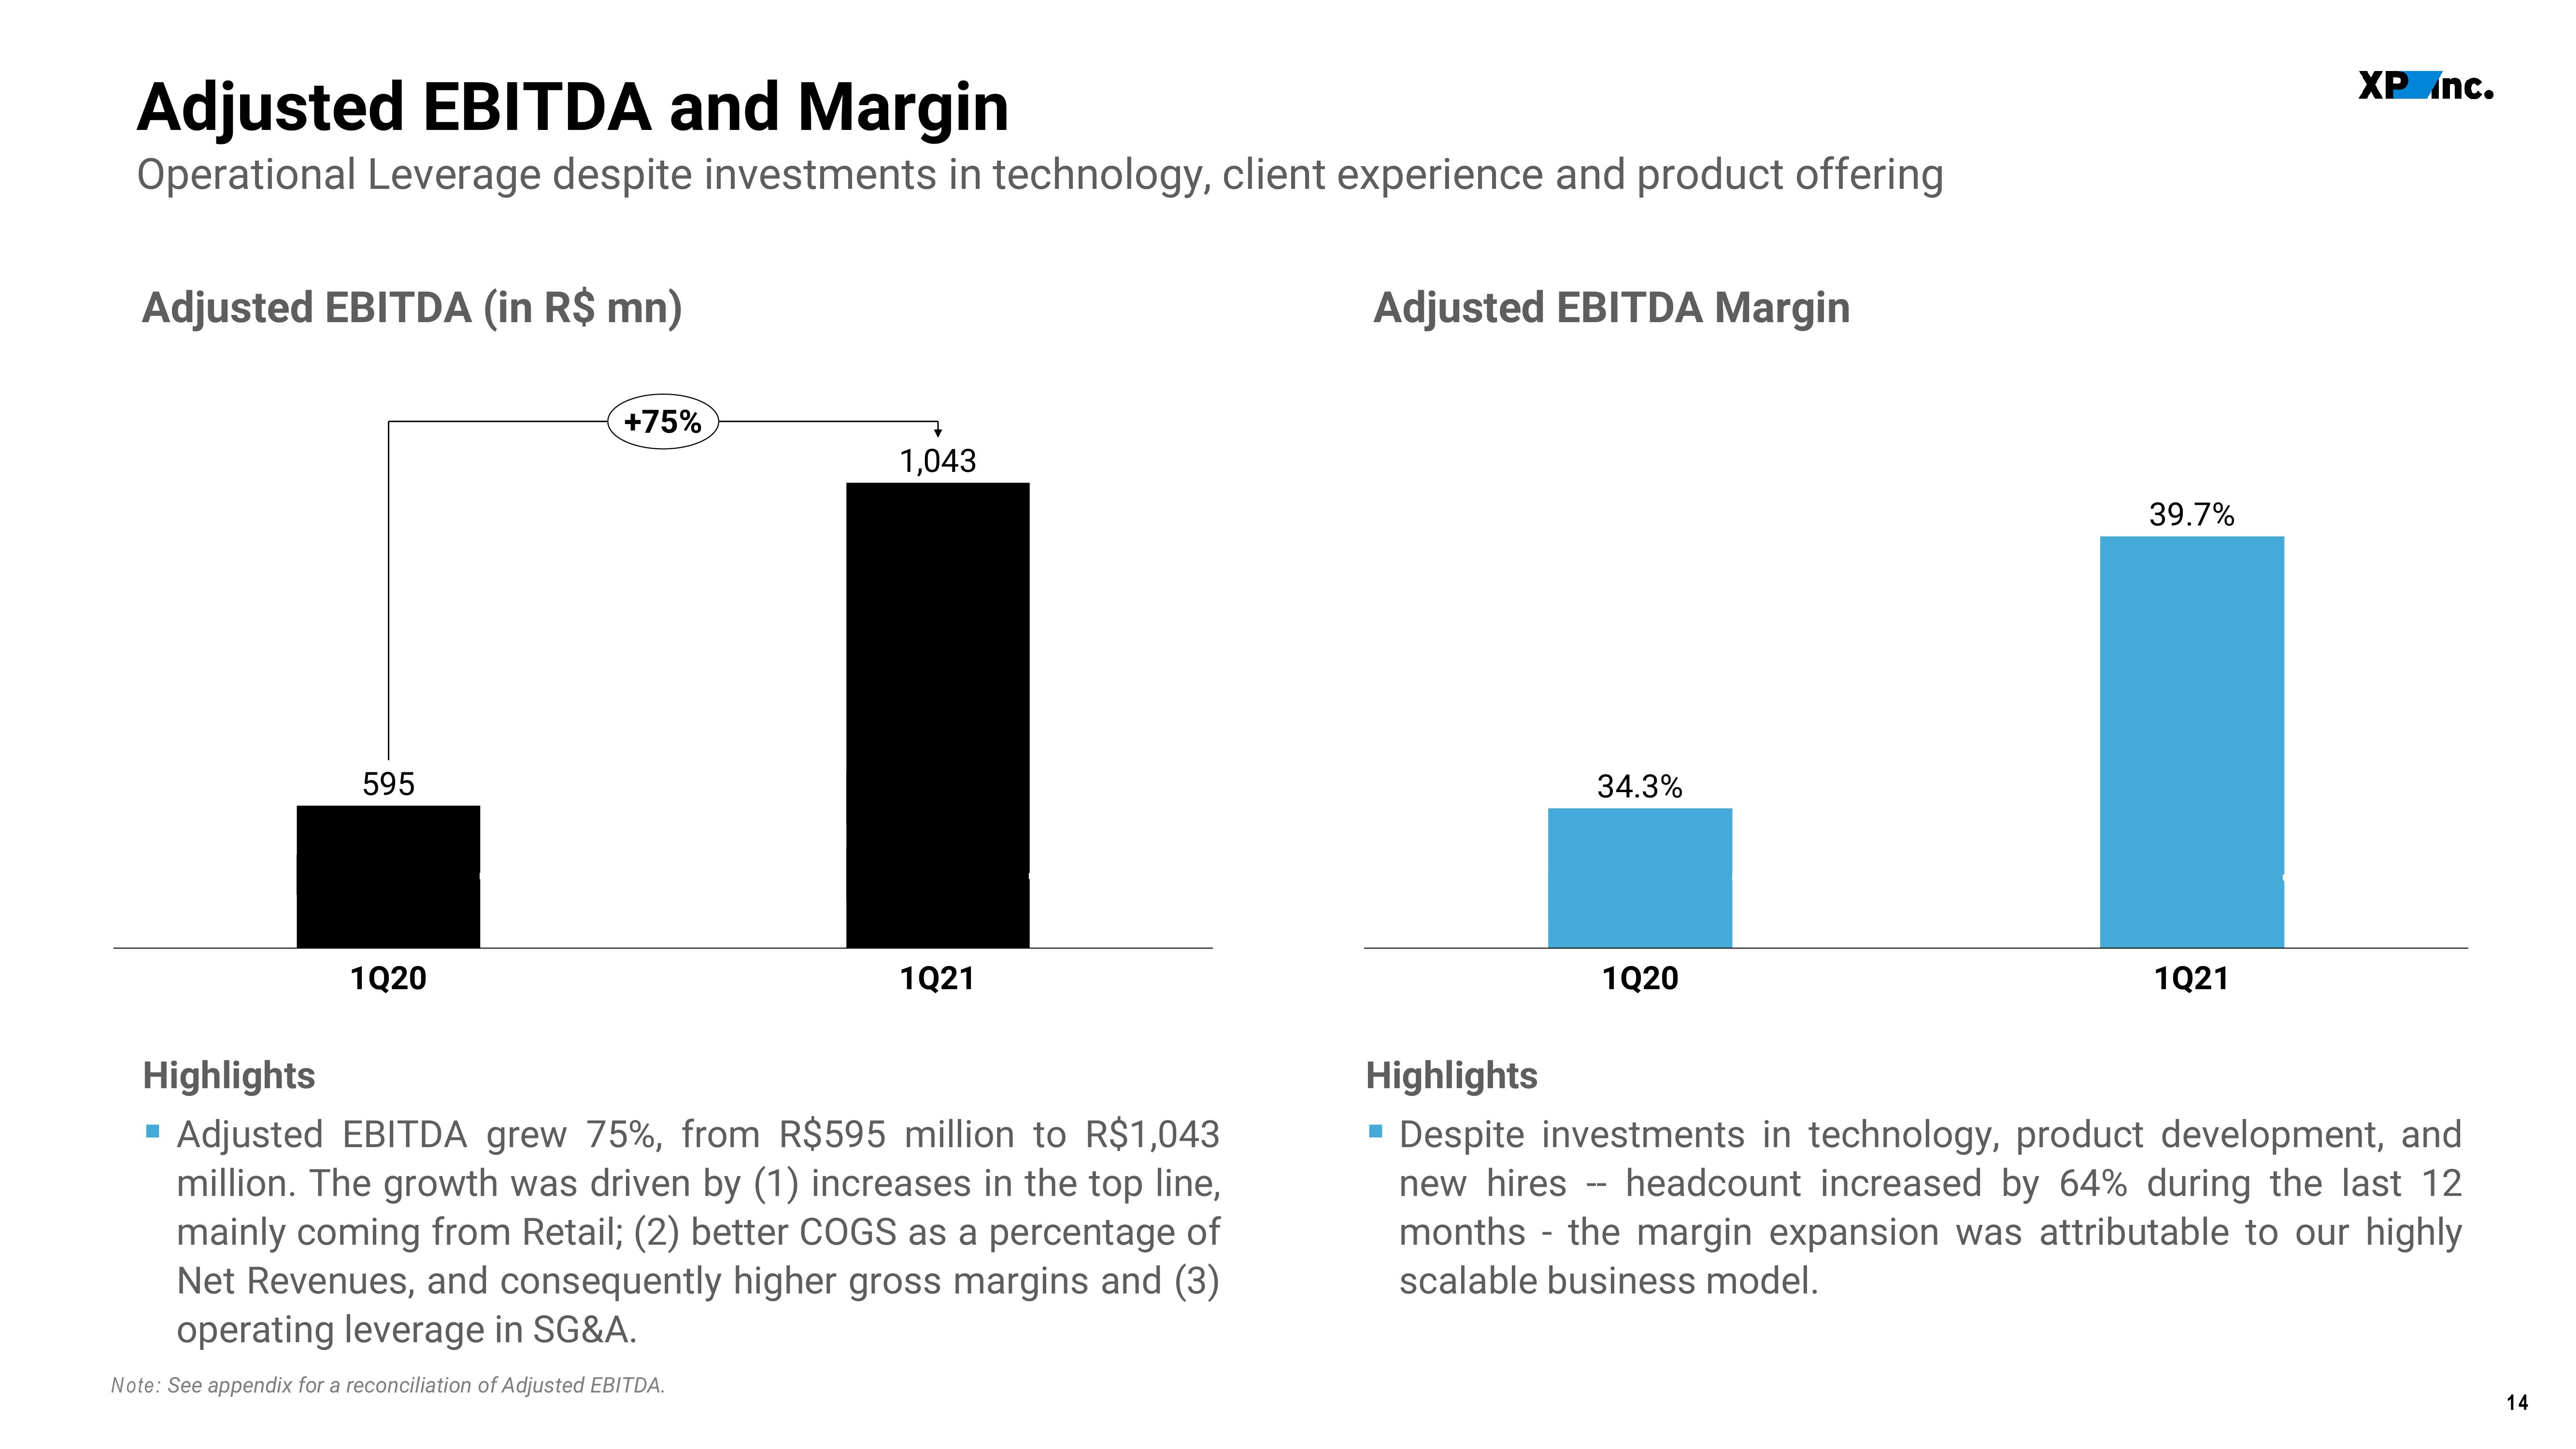
Adjusted EBITDA grew 75%, from R$595 million to R$1,043
million. The growth was driven by (1) increases in the top line,
mainly coming from Retail; (2) better COGS as a percentage of
Net Revenues, and consequently higher gross margins and (3)
operating leverage in SG&A.
Note: See appendix for a reconciliation of Adjusted EBITDA.
Adjusted EBITDA Margin
34.3%
■
1Q20
39.7%
1Q21
XP nc.
Highlights
Despite investments in technology, product development, and
new hires headcount increased by 64% during the last 12
months the margin expansion was attributable to our highly
scalable business model.
14View entire presentation