Diploma Results Presentation Deck
26
Diploma PLC
Half Year 2023 Results
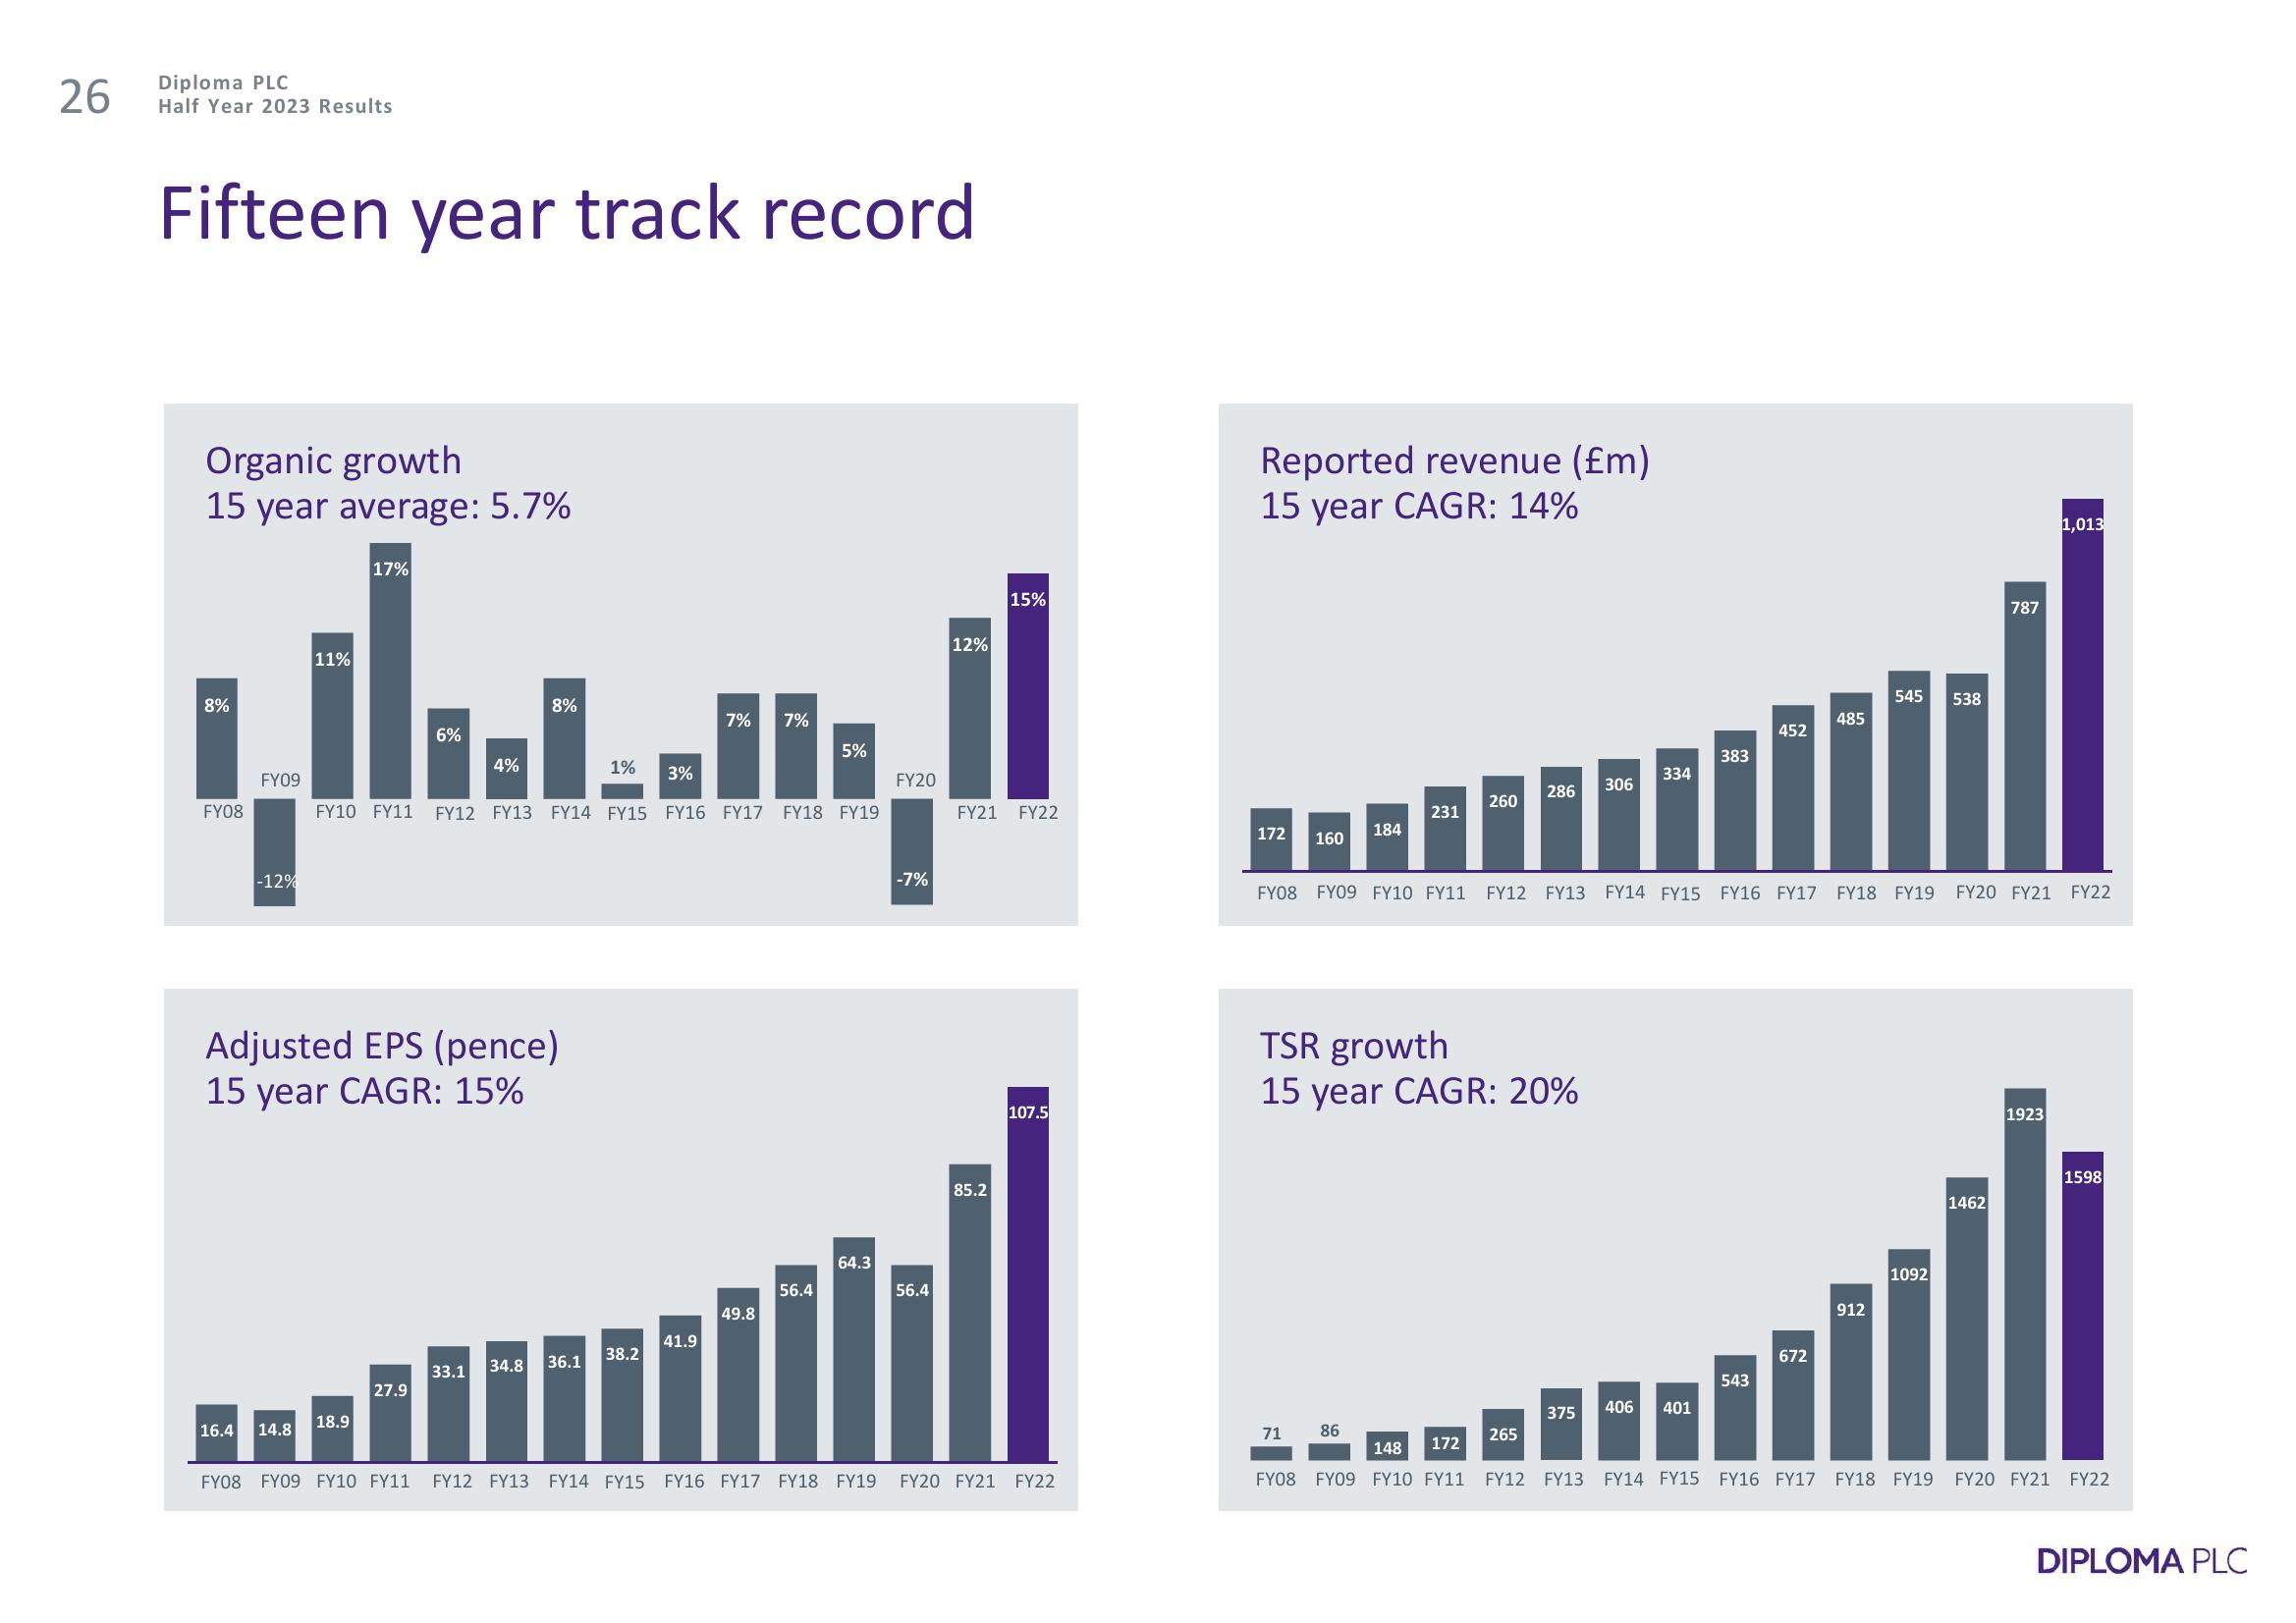
Fifteen year track record
Organic growth
15 year average: 5.7%
8%
8%
ylvanill
7% 7%
6%
4%
1%
3%
FY10 FY11 FY12 FY13 FY14 FY15 FY16 FY17 FY18 FY19
FY08
FY09
-12%
FY08
16.4 14.8
11%
Adjusted EPS (pence)
15 year CAGR: 15%
17%
18.9
27.9
33.1 34.8
41.9
38.2
36.1
49.8
56.4
5%
64.3
FY20
-7%
56.4
12%
15%
FY21 FY22
85.2
107.5
FY09 FY10 FY11 FY12 FY13 FY14 FY15 FY16 FY17 FY18 FY19 FY20 FY21 FY22
Reported revenue (£m)
15 year CAGR: 14%
172
160
71
184
231
86
260
TSR growth
15 year CAGR: 20%
286 306
265
334
383
375 406 401
452
FY08 FY09 FY10 FY11 FY12 FY13 FY14 FY15 FY16 FY17 FY18 FY19 FY20 FY21 FY22
543
485
672
545
912
538
1092
787
1462
1,013
1923
1598
148 172
FY08 FY09 FY10 FY11 FY12 FY13 FY14 FY15 FY16 FY17 FY18 FY19 FY20 FY21 FY22
DIPLOMA PLCView entire presentation