Ares US Real Estate Opportunity Fund III
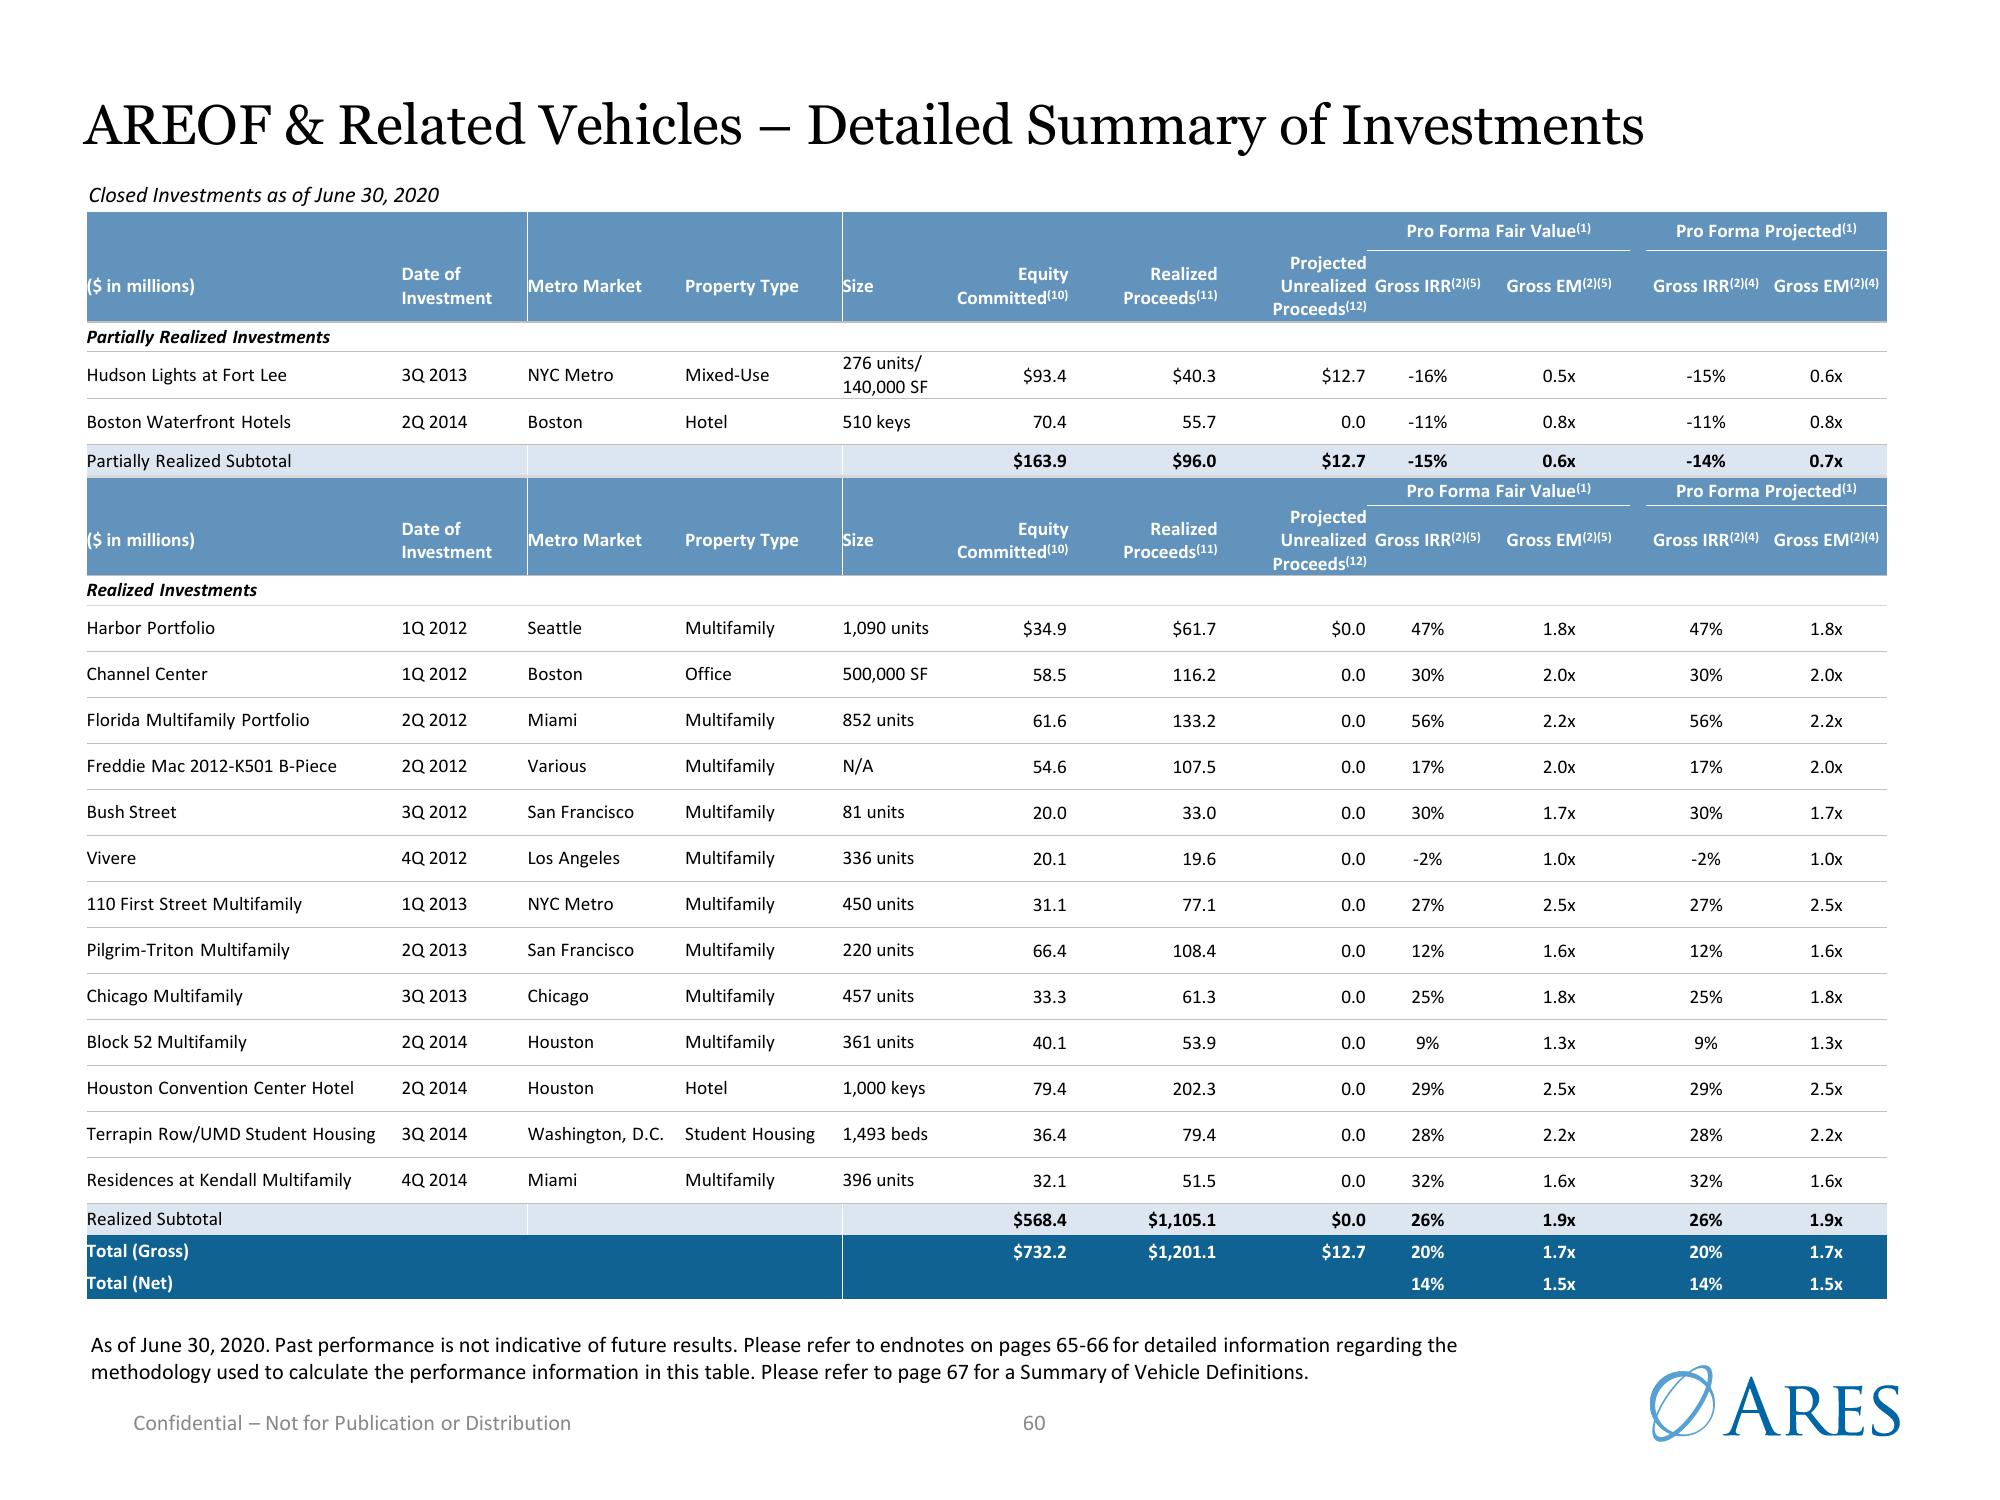
AREOF & Related Vehicles - Detailed Summary of Investments
Closed Investments as of June 30, 2020
($ in millions)
Partially Realized Investments
Hudson Lights at Fort Lee
Boston Waterfront Hotels
Partially Realized Subtotal
($ in millions)
Realized Investments
Harbor Portfolio
Channel Center
Florida Multifamily Portfolio
Freddie Mac 2012-K501 B-Piece
Bush Street
Vivere
110 First Street Multifamily
Pilgrim-Triton Multifamily
Chicago Multifamily
Block 52 Multifamily
Houston Convention Center Hotel
Date of
Investment
3Q 2013
2Q 2014
Date of
Investment
1Q 2012
1Q 2012
2Q 2012
2Q 2012
3Q 2012
4Q 2012
1Q 2013
2Q 2013
3Q 2013
2Q 2014
2Q 2014
Terrapin Row/UMD Student Housing
Residences at Kendall Multifamily 4Q 2014
Realized Subtotal
Total (Gross)
Total (Net)
3Q 2014
Metro Market
NYC Metro
Boston
Metro Market
Seattle
Boston
Miami
Various
San Francisco
Los Angeles
NYC Metro
San Francisco
Chicago
Houston
Houston
Washington, D.C.
Miami
Property Type
Mixed-Use
Hotel
Property Type
Multifamily
Office
Multifamily
Multifamily
Multifamily
Multifamily
Multifamily
Multifamily
Multifamily
Multifamily
Hotel
Student Housing
Multifamily
Size
276 units/
140,000 SF
510 keys
Size
1,090 units
500,000 SF
852 units
N/A
81 units
336 units
450 units
220 units
457 units
361 units
1,000 keys
1,493 beds
396 units
Equity
Committed (10)
$93.4
70.4
$163.9
Equity
Committed (10)
$34.9
58.5
61.6
54.6
20.0
20.1
31.1
66.4
33.3
40.1
79.4
36.4
32.1
$568.4
$732.2
Realized
Proceeds (11)
60
$40.3
55.7
$96.0
Realized
Proceeds(11)
$61.7
116.2
133.2
107.5
33.0
19.6
77.1
108.4
61.3
53.9
202.3
79.4
51.5
$1,105.1
$1,201.1
Projected
Unrealized Gross IRR(2)(5) Gross EM(2)(5)
Proceeds(12)
$12.7
0.0
$12.7
$0.0
0.0
0.0
Projected
Unrealized Gross IRR(2)(5)
Proceeds(12)
0.0
0.0
0.0
0.0
0.0
0.0
0.0
0.0
0.0
Pro Forma Fair Value(¹)
0.0
$0.0
$12.7
-16%
-11%
-15%
0.6x
Pro Forma Fair Value(¹)
47%
30%
56%
17%
30%
-2%
27%
12%
25%
9%
29%
28%
32%
26%
20%
14%
As of June 30, 2020. Past performance is not indicative of future results. Please refer to endnotes on pages 65-66 for detailed information regarding the
methodology used to calculate the performance information in this table. Please refer to page 67 for a Summary of Vehicle Definitions.
Confidential - Not for Publication or Distribution
0.5x
0.8x
Gross EM(2)(5)
1.8x
2.0x
2.2x
2.0x
1.7x
1.0x
2.5x
1.6x
1.8x
1.3x
2.5x
2.2x
1.6x
1.9x
1.7x
1.5x
Pro Forma Projected (1)
Gross IRR(2)(4) Gross EM(2)(4)
-15%
-11%
-14%
0.7x
Pro Forma Projected (¹)
47%
Gross IRR(2)(4) Gross EM(2)(4)
30%
56%
17%
30%
-2%
27%
12%
25%
9%
29%
28%
0.6x
32%
0.8x
26%
20%
14%
1.8x
2.0x
2.2x
2.0x
1.7x
1.0x
2.5x
1.6x
1.8x
1.3x
2.5x
2.2x
1.6x
1.9x
1.7x
1.5x
ARESView entire presentation