Ford Investor Conference Presentation Deck
U.S. Lease
Metrics
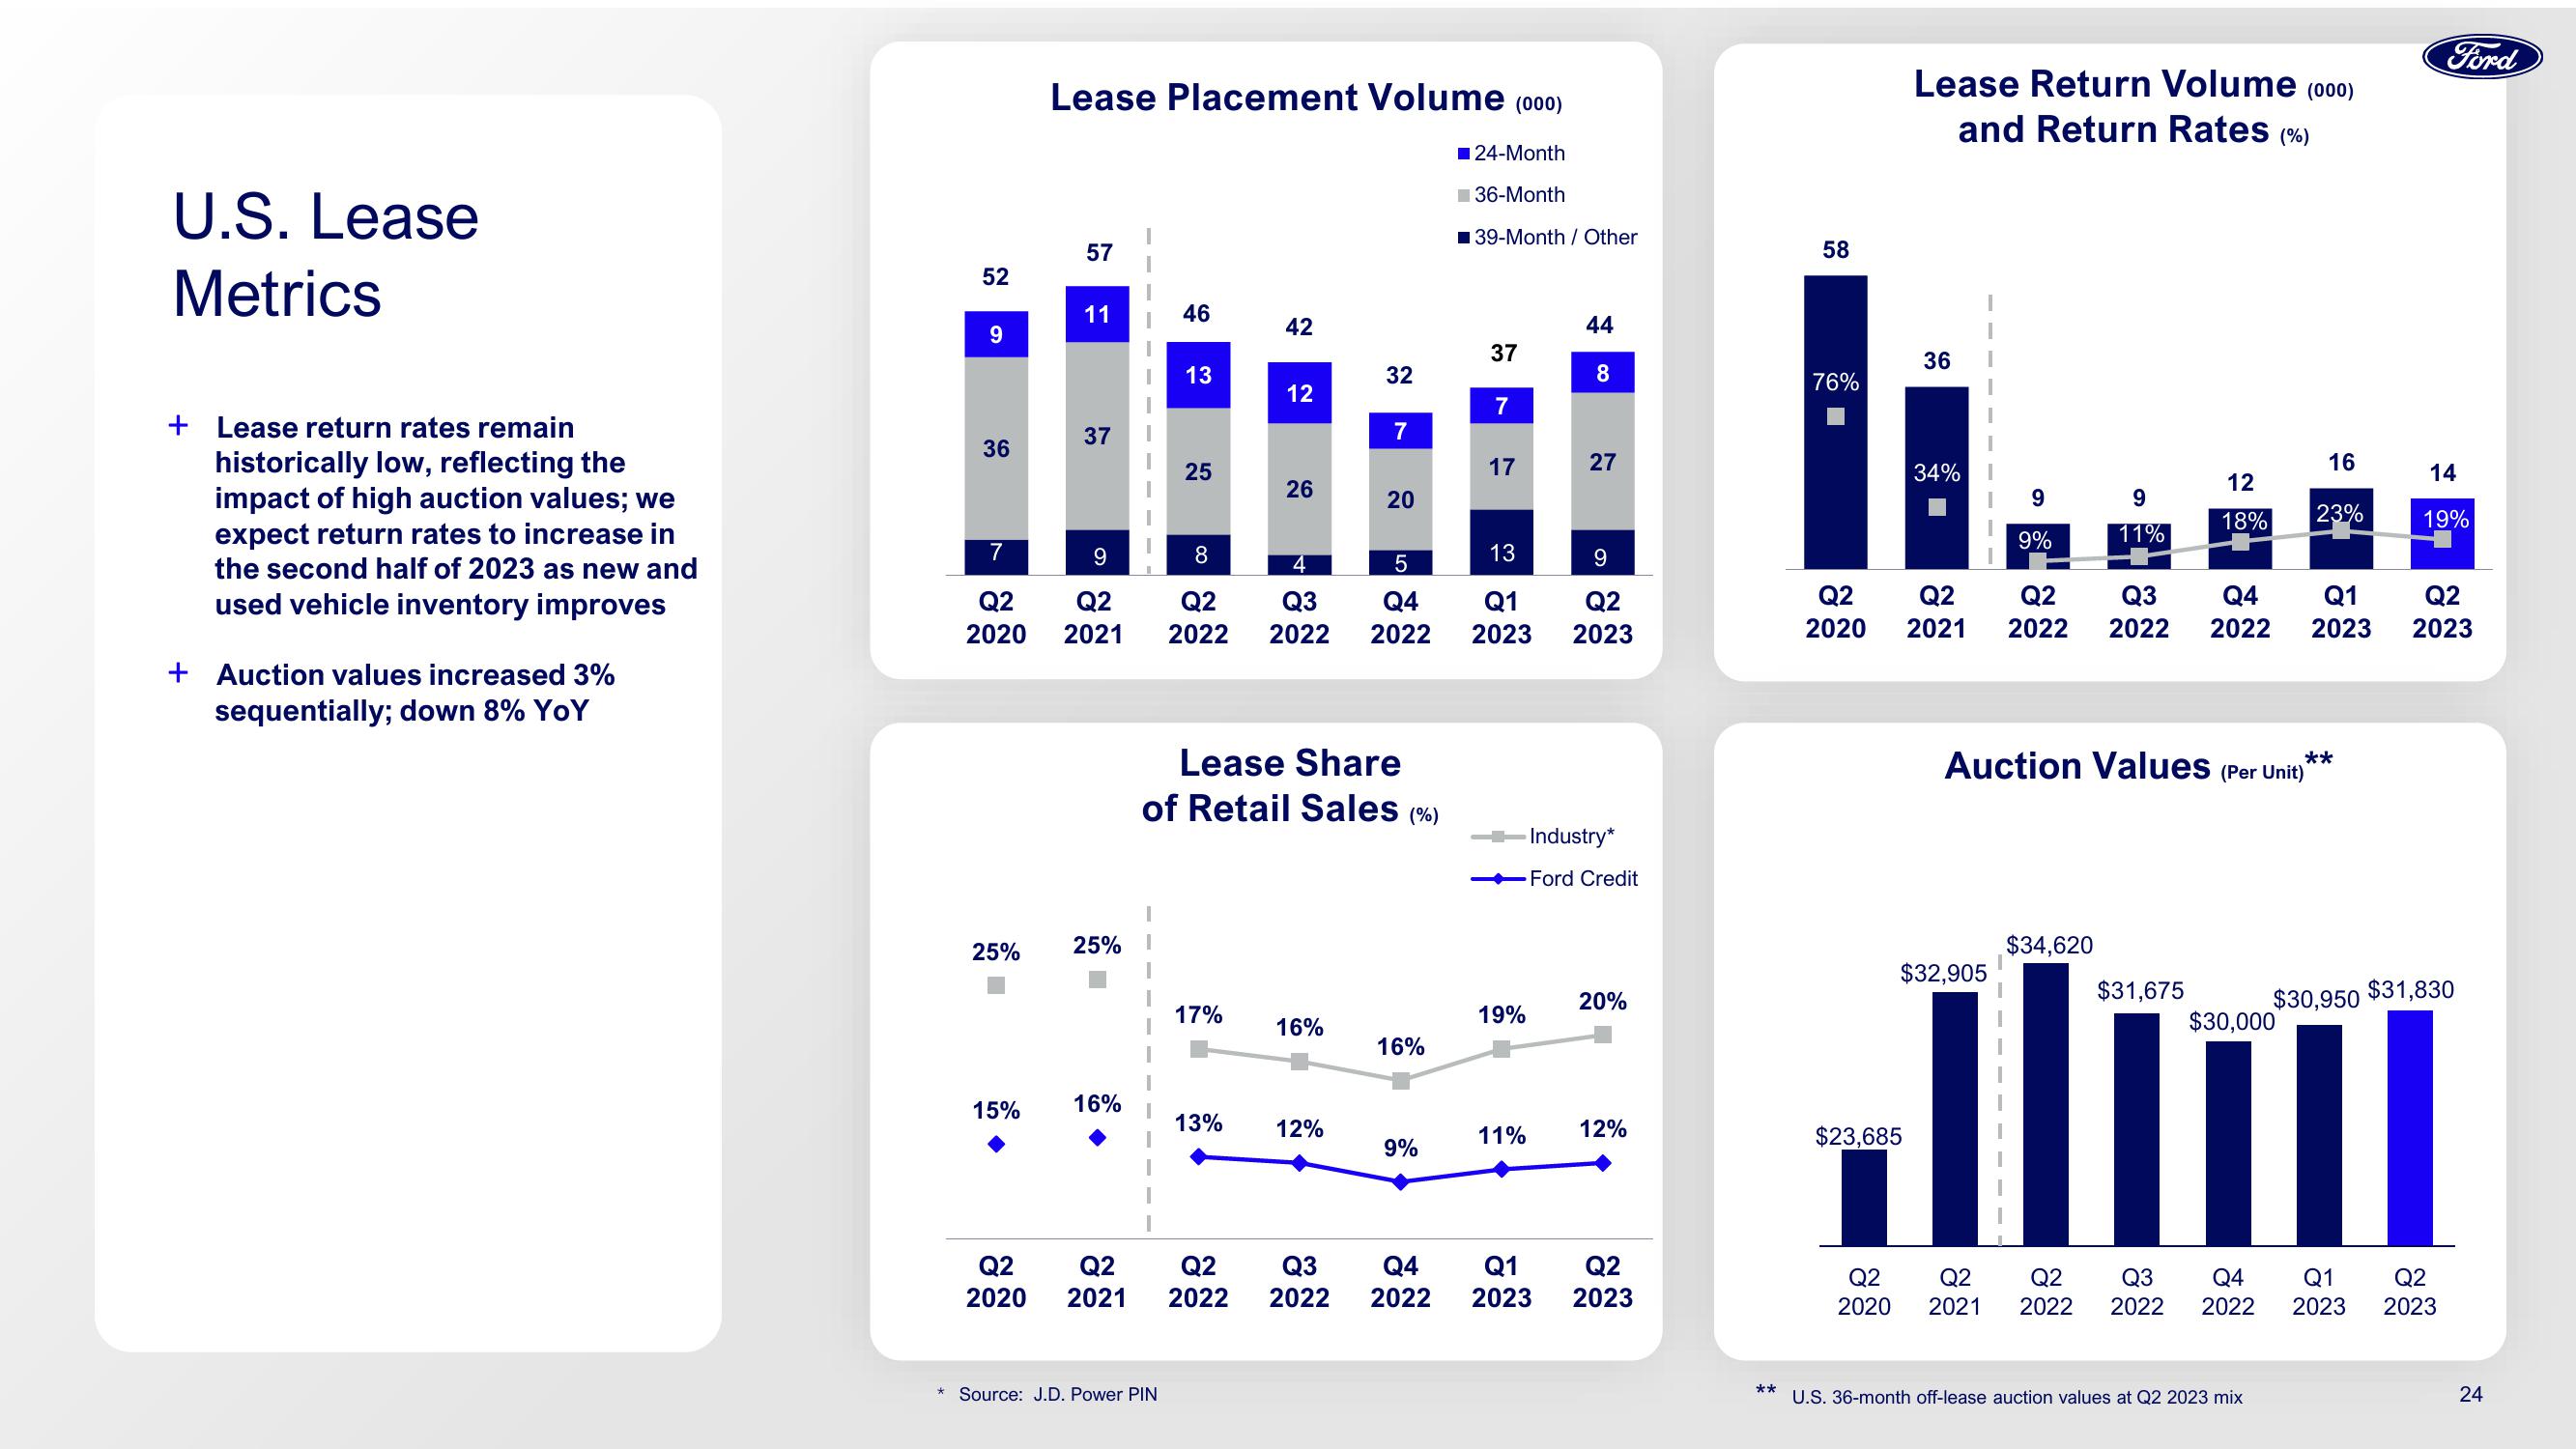
+ Lease return rates remain
historically low, reflecting the
impact of high auction values; we
expect return rates to increase in
the second half of 2023 as new and
used vehicle inventory improves
+ Auction values increased 3%
sequentially; down 8% YoY
52
9
36
7
Q2
2020
25%
15%
Lease Placement Volume (000)
24-Month
36-Month
39-Month/ Other
57
11
37
9
Q2
2021
25%
16%
46
13
Source: J.D. Power PIN
25
42
17%
12
13%
26
8
4
5
Q2 Q3 Q4
2022 2022 2022
Lease Share
of Retail Sales
16%
32
12%
Q2 Q2 Q2 Q3
2020 2021 2022 2022
7
20
(%)
16%
9%
37
7
17
13
Q1
2023
19%
11%
44
8
- Industry*
- Ford Credit
Q4 Q1
2022
2023
27
9
Q2
2023
20%
12%
Q2
2023
**
58
76%
Lease Return Volume (000)
and Return Rates (%)
$23,685
20
36
Q2 Q2
2020 2021
34%
$32,905
9
9%
Q2
2020 2021
9
11%
**
Auction Values (Per Unit)
$34,620
12
18%
Q2 Q3 Q4 Q1
2022 2022 2022 2023
$31,675
16
23%
$30,000
Q2 Q3 Q4
2022 2022 2022
U.S. 36-month off-lease auction values at Q2 2023 mix
Q1
2023
Ford
14
19%
$30,950 $31,830
Q2
2023
Q2
2023
24View entire presentation