Mesirow Private Equity
History of Consistent Outperformance
Core Co-Investment Track Record as of 6/30/2021
2.
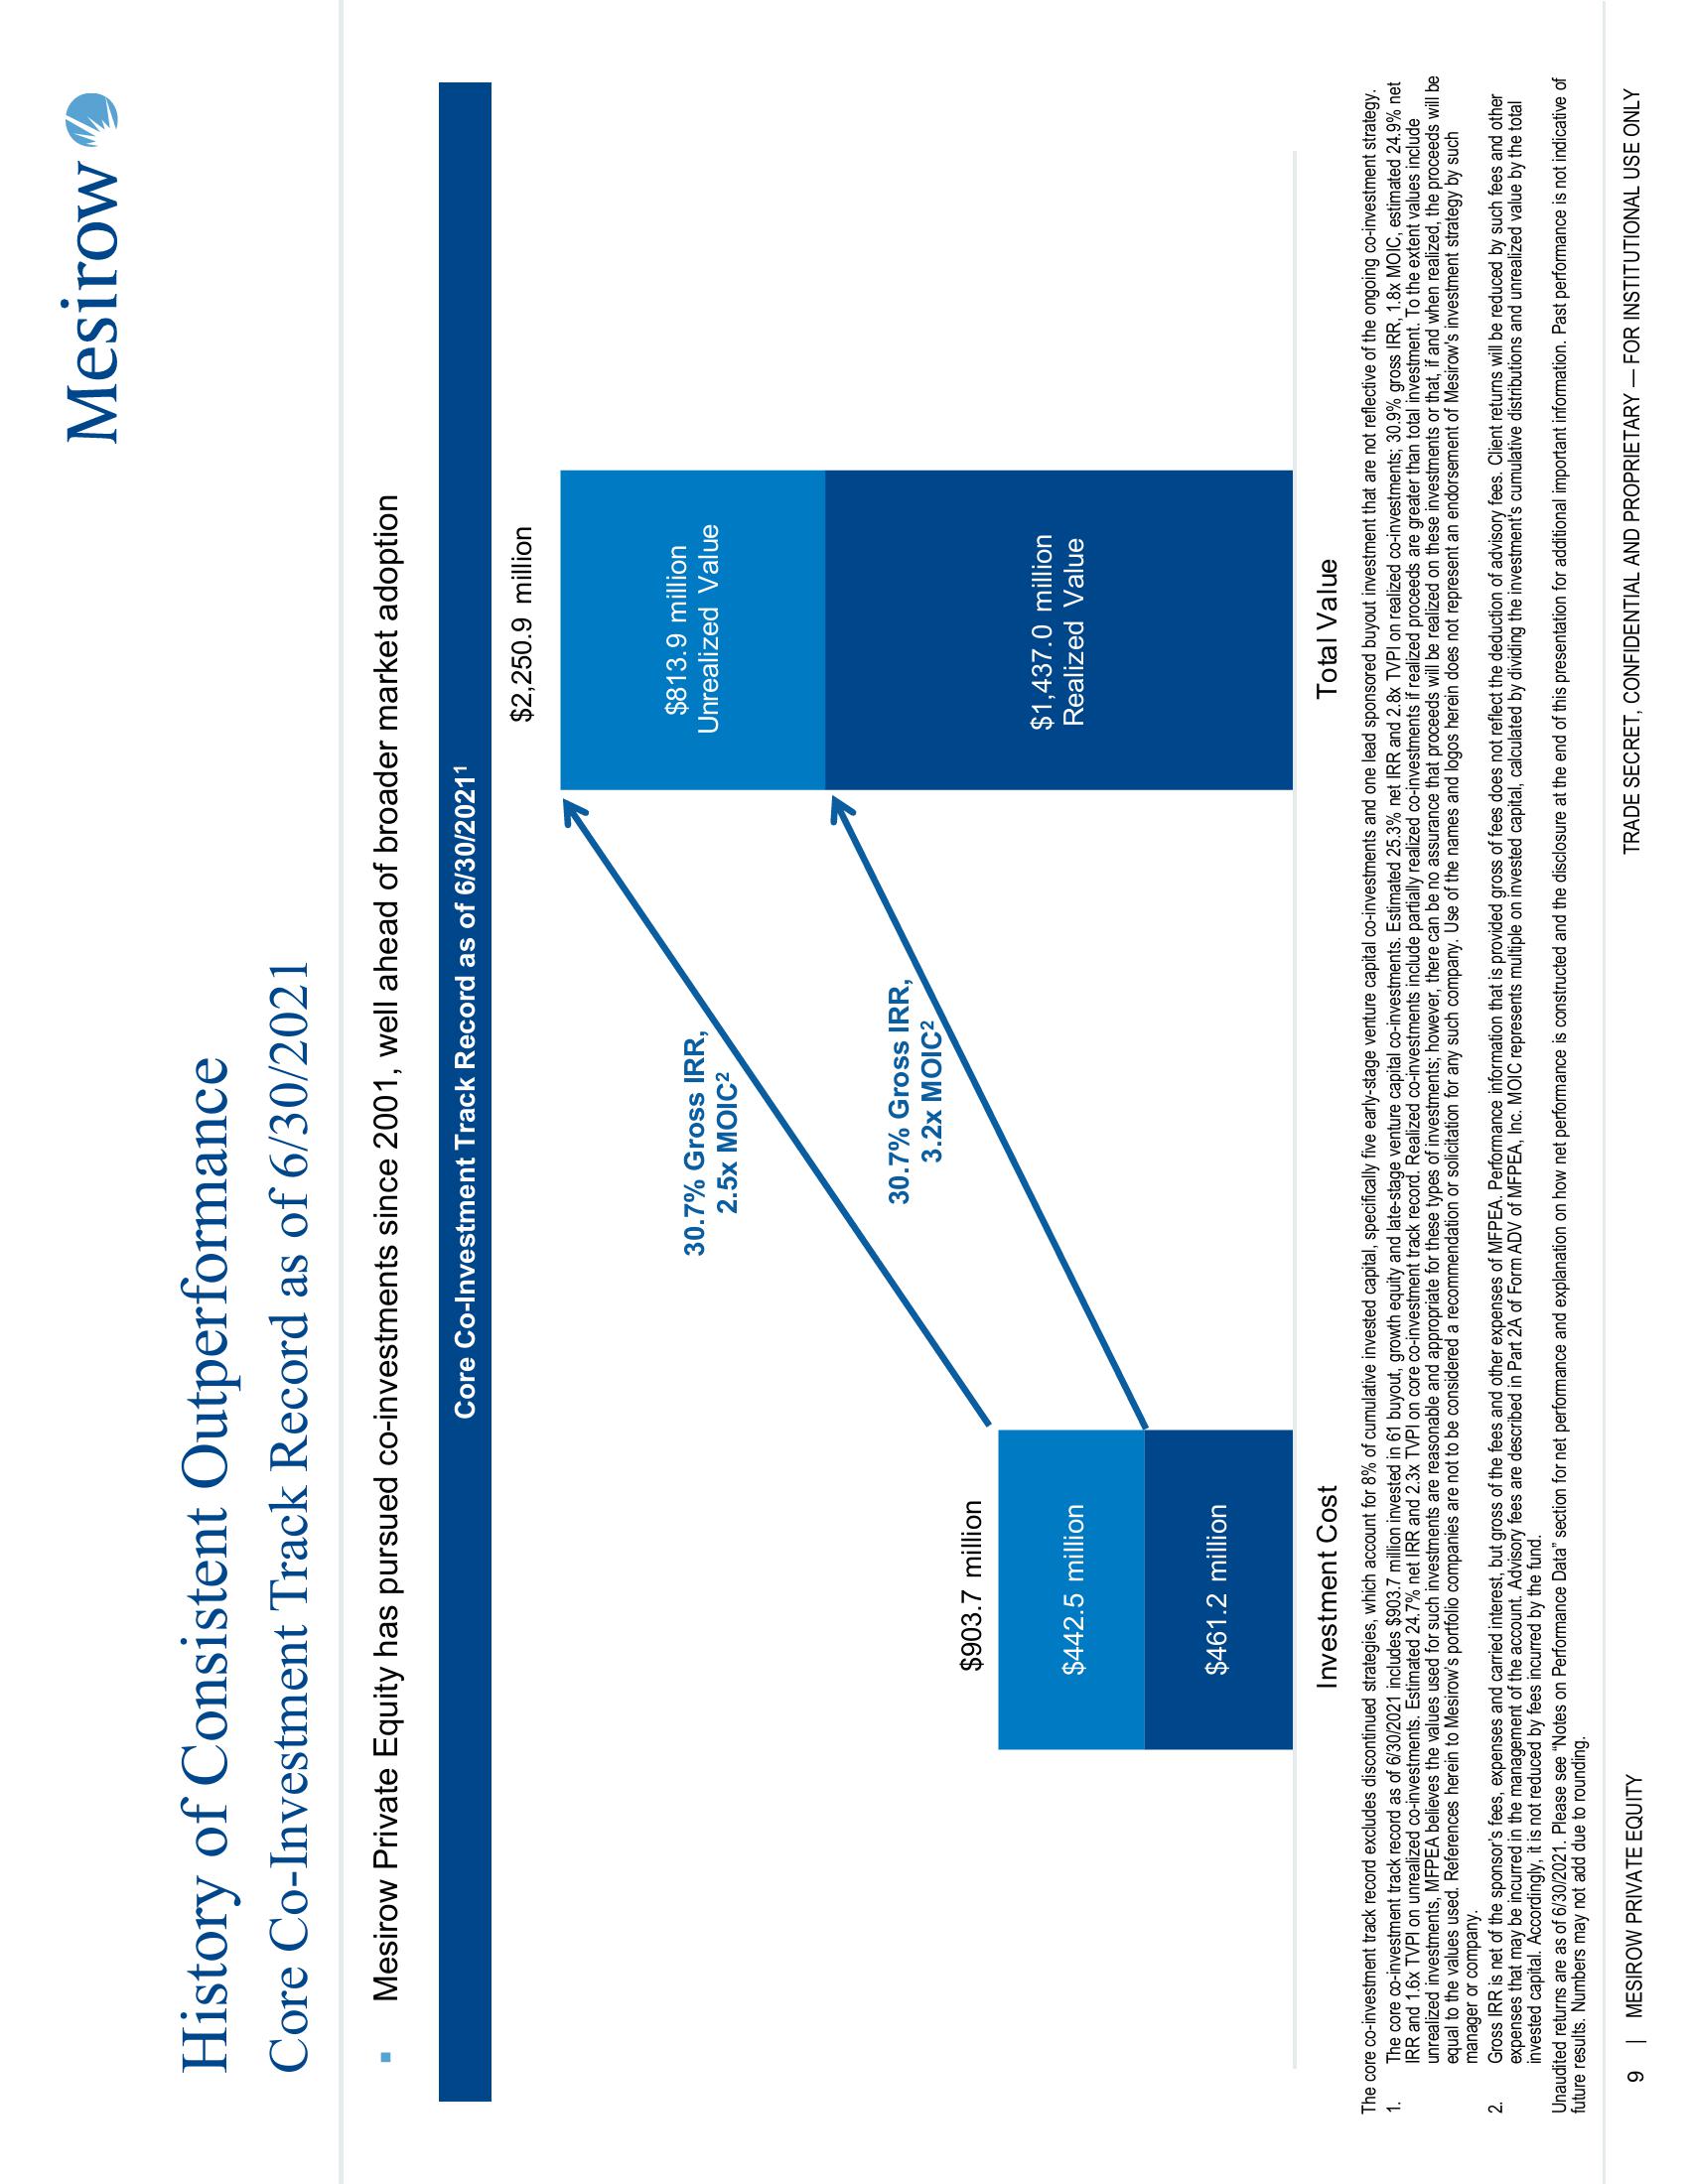
Mesirow Private Equity has pursued co-investments since 2001, well ahead of broader market adoption
$903.7 million
$442.5 million
9 | MESIROW PRIVATE EQUITY
$461.2 million
Core Co-Investment Track Record as of 6/30/20211
30.7% Gross IRR,
2.5x MOIC²
30.7% Gross IRR,
3.2x MOIC²
$2,250.9 million
$813.9 million
Unrealized Value
$1,437.0 million
Realized Value
Investment Cost
Total Value
The core co-investment track record excludes discontinued strategies, which account for 8% of cumulative invested capital, specifically five early-stage venture capital co-investments and one lead sponsored buyout investment that are not reflective of the ongoing co-investment strategy.
1. The core co-investment track record as of 6/30/2021 includes $903.7 million invested in 61 buyout, growth equity and late-stage venture capital co-investments. Estimated 25.3% net IRR and 2.8x TVPI on realized co-investments; 30.9% gross IRR, 1.8x MOIC, estimated 24.9% net
IRR and 1.6x TVPI on unrealized co-investments. Estimated 24.7% net IRR and 2.3x TVPI on core co-investment track record. Realized co-investments include partially realized co-investments if realized proceeds are greater than total investment. To the extent values include
unrealized investments, MFPEA believes the values used for such investments are reasonable and appropriate for these types of investments; however, there can be no assurance that proceeds will be realized on these investments or that, if and when realized, the proceeds will be
equal to the values used. References herein to Mesirow's portfolio companies are not to be considered a recommendation or solicitation for any such company. Use of the names and logos herein does not represent an endorsement of Mesirow's investment strategy by such
manager or company.
Gross IRR is net of the sponsor's fees, expenses and carried interest, but gross of the fees and other expenses of MFPEA. Performance information that is provided gross of fees does not reflect the deduction of advisory fees. Client returns will be reduced by such fees and other
expenses that may be incurred in the management of the account. Advisory fees are described in Part 2A of Form ADV of MFPEA, Inc. MOIC represents multiple on invested capital, calculated by dividing the investment's cumulative distributions and unrealized value by the total
invested capital. Accordingly, it is not reduced by fees incurred by the fund.
Mesirow
Unaudited returns are as of 6/30/2021. Please see "Notes on Performance Data" section for net performance and explanation on how net performance is constructed and the disclosure at the end of this presentation for additional important information. Past performance is not indicative of
future results. Numbers may not add due to rounding.
TRADE SECRET, CONFIDENTIAL AND PROPRIETARY FOR INSTITUTIONAL USE ONLYView entire presentation