Benson Hill SPAC Presentation Deck
BENSON HILL
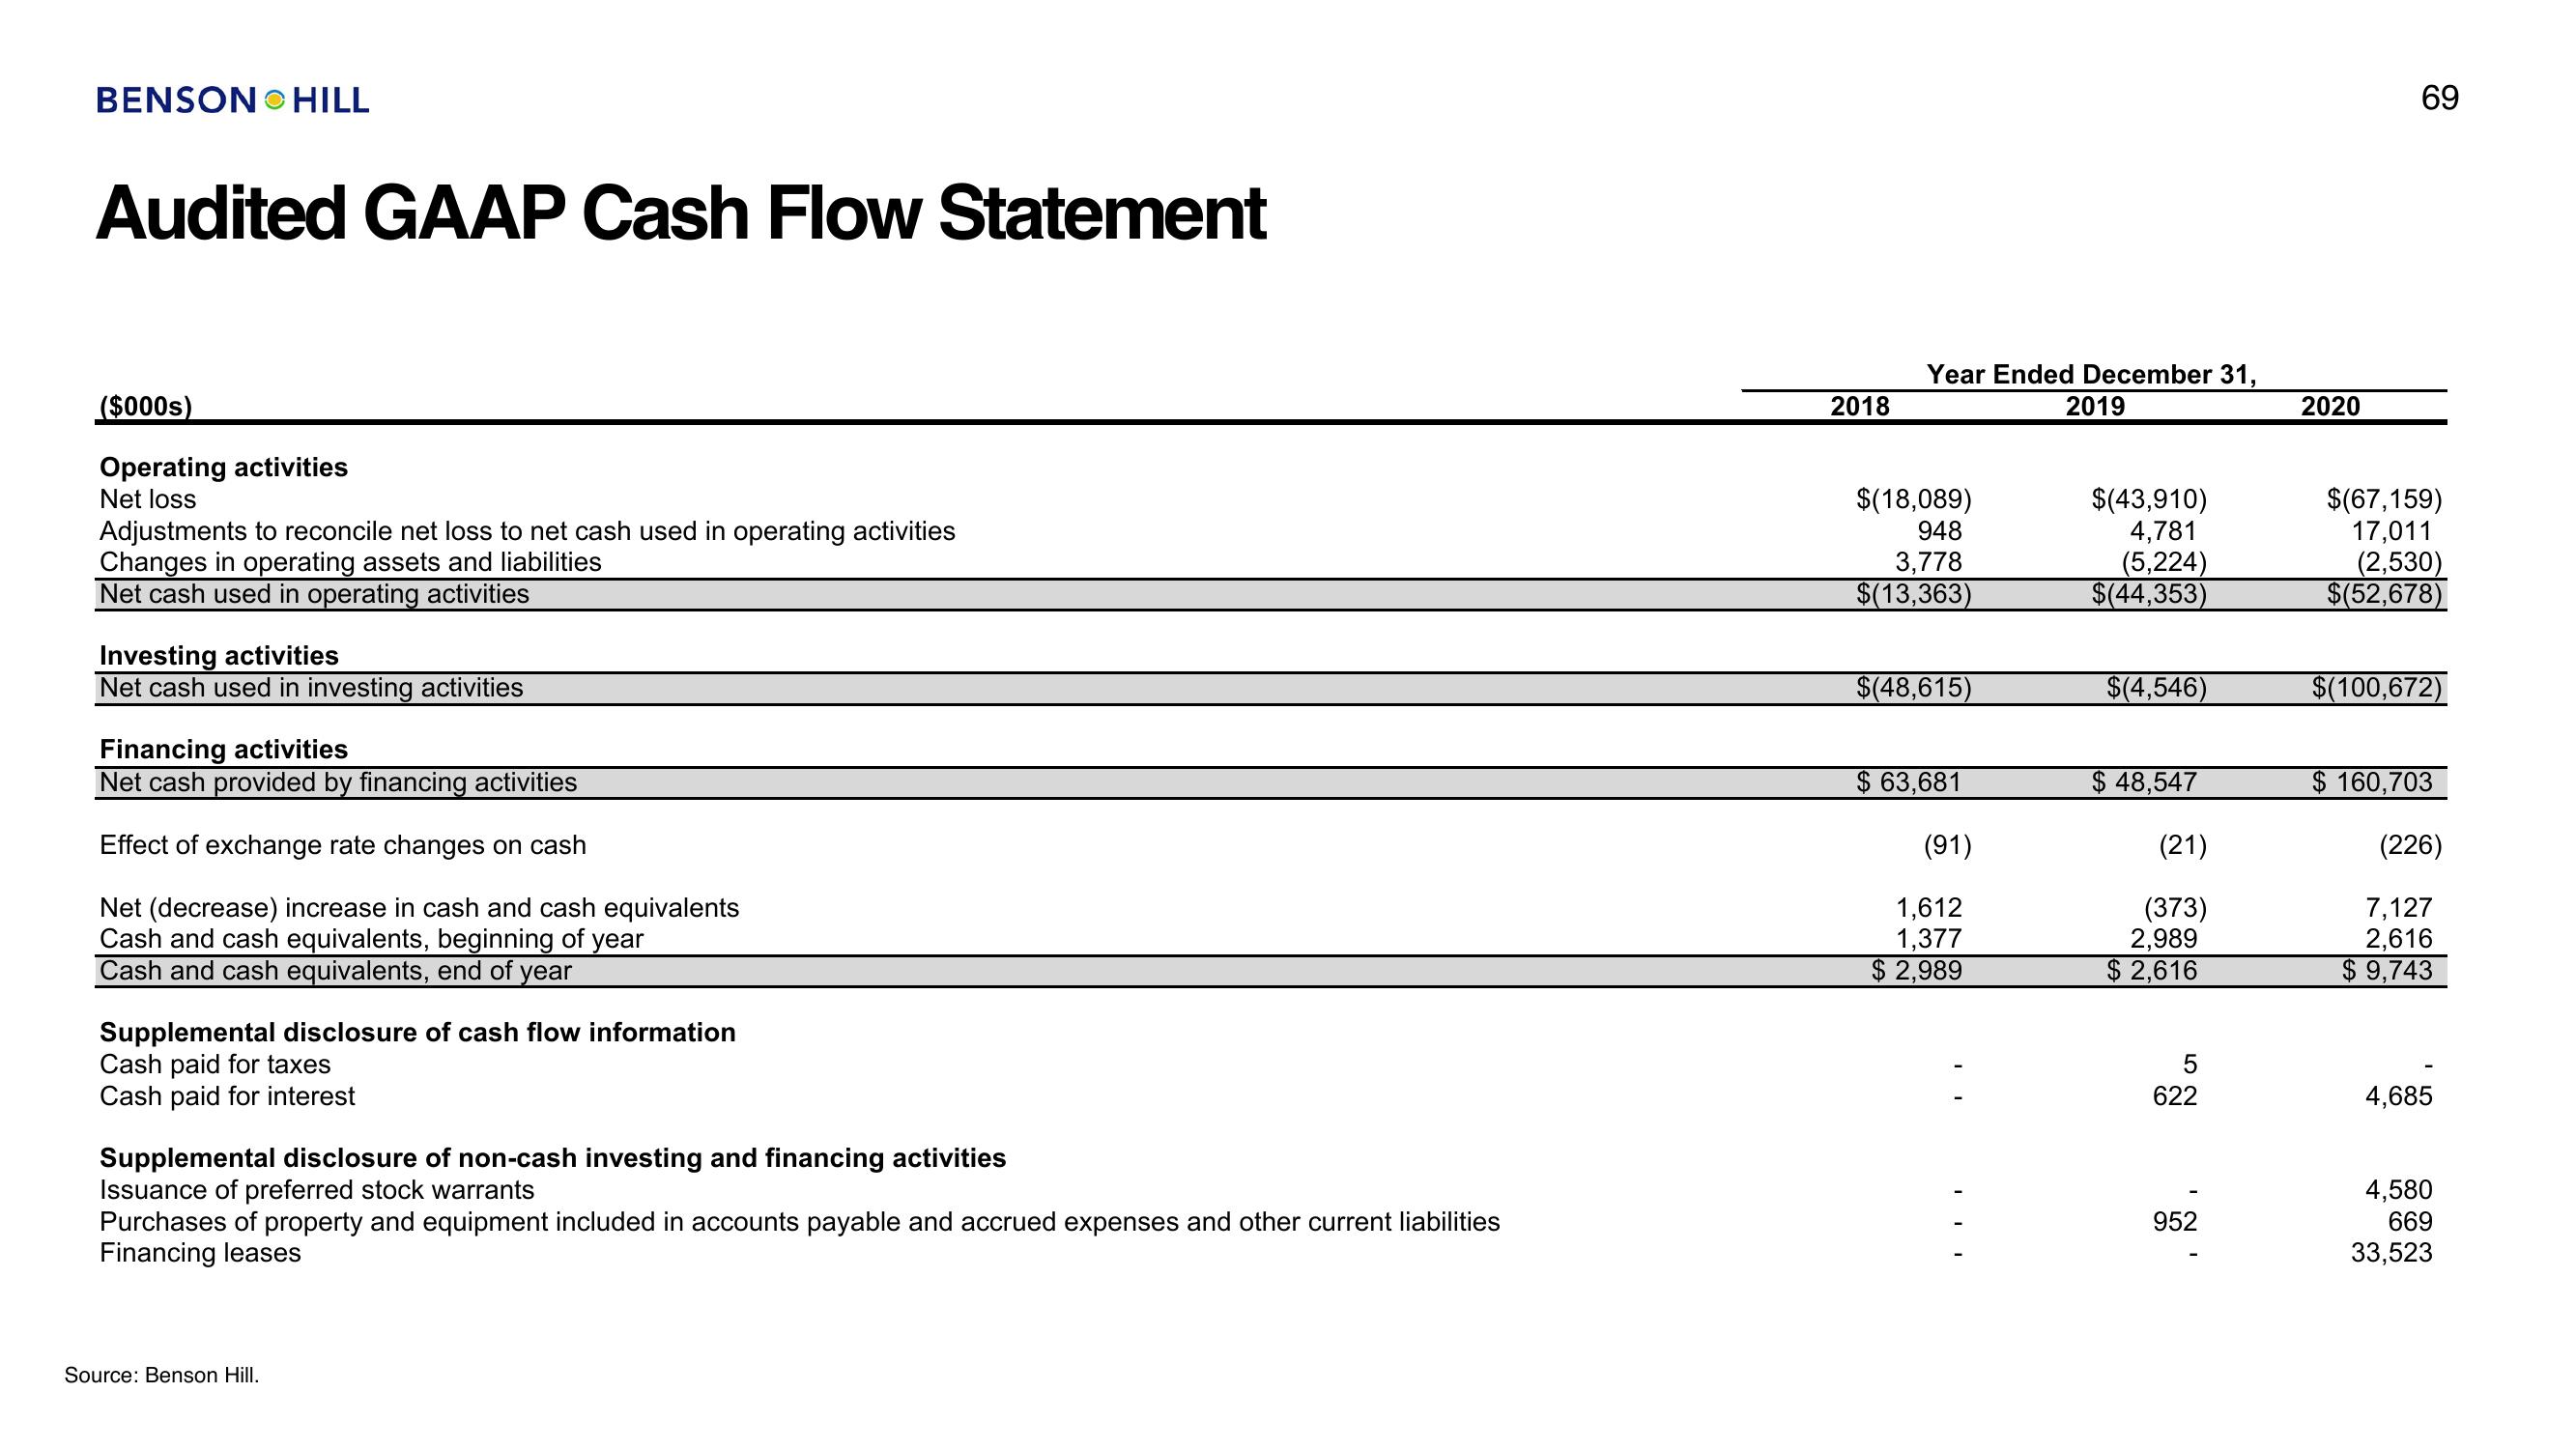
Audited GAAP Cash Flow Statement
($000s)
Operating activities
Net loss
Adjustments to reconcile net loss to net cash used in operating activities
Changes in operating assets and liabilities
Net cash used in operating activities
Investing activities
Net cash used in investing activities
Financing activities
Net cash provided by financing activities
Effect of exchange rate changes on cash
Net (decrease) increase in cash and cash equivalents
Cash and cash equivalents, beginning of year
Cash and cash equivalents, end of year
Supplemental disclosure of cash flow information
Cash paid for taxes
Cash paid for interest
Supplemental disclosure of non-cash investing and financing activities
Issuance of preferred stock warrants
Purchases of property and equipment included in accounts payable and accrued expenses and other current liabilities
Financing leases
Source: Benson Hill.
2018
Year Ended December 31,
$(18,089)
948
3,778
$(13,363)
$(48,615)
$ 63,681
(91)
1,612
1,377
$ 2,989
:
2019
$(43,910)
4,781
(5,224)
$(44,353)
$(4,546)
$ 48,547
(21)
(373)
2,989
$2,616
5
622
952
2020
69
$(67,159)
17,011
(2,530)
$(52,678)
$(100,672)
$ 160,703
(226)
7,127
2,616
$ 9,743
4,685
4,580
669
33,523View entire presentation