Paysafe Results Presentation Deck
Q1 financial highlights
Volume ($bn)
$25.6
Q1 2020
$112.8
+8%
Q1 2020
Adj. EBITDA (¹) ($m)
$27.7
flat
Q1 2021
$113.2
Q1 2021
30.0%
take rate
Revenue ($m)
$359.7
Q1 2020
1.4%
FCF(¹) ($m)
$84.4
+5%
Q1 2020
29%
$377.4
Q1 2021
1.4%
$108.5
Q1 2021
●
●
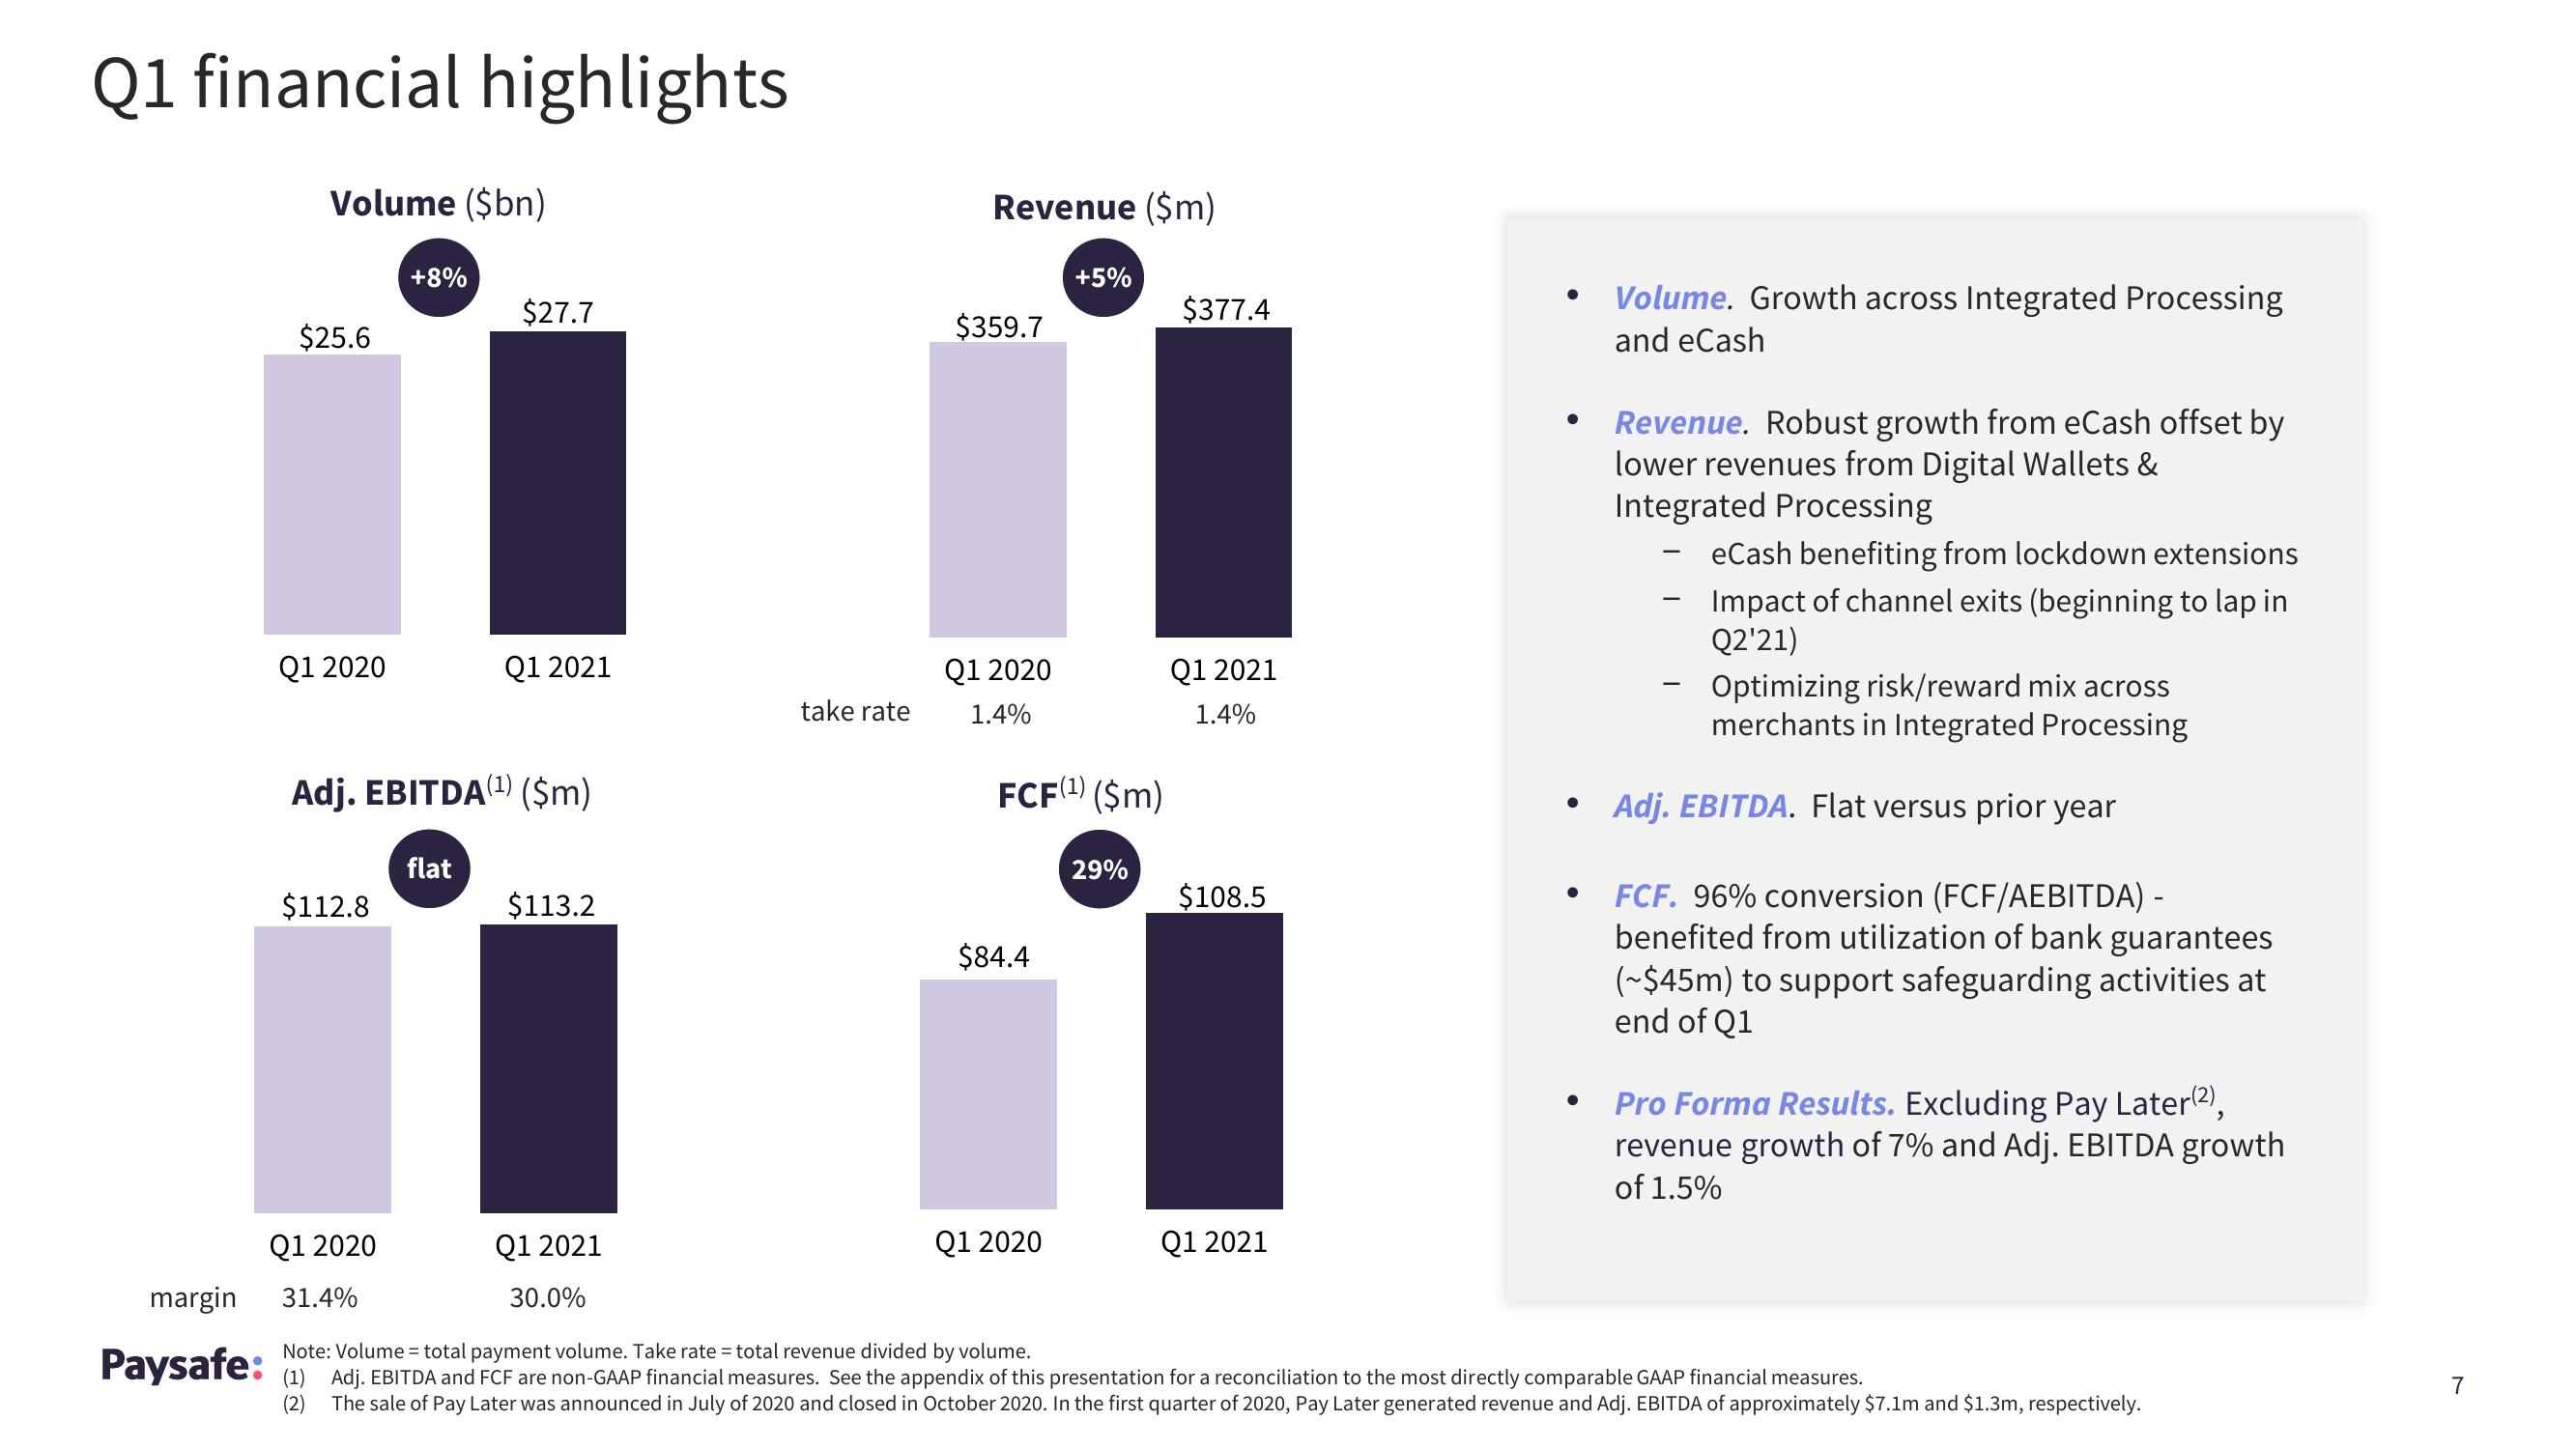
Volume. Growth across Integrated Processing
and eCash
Revenue. Robust growth from eCash offset by
lower revenues from Digital Wallets &
Integrated Processing
eCash benefiting from lockdown extensions
Impact of channel exits (beginning to lap in
Q2'21)
Optimizing risk/reward mix across
merchants in Integrated Processing
Adj. EBITDA. Flat versus prior year
FCF. 96% conversion (FCF/AEBITDA) -
benefited from utilization of bank guarantees
(~$45m) to support safeguarding activities at
end of Q1
Pro Forma Results. Excluding Pay Later(²),
revenue growth of 7% and Adj. EBITDA growth
of 1.5%
margin 31.4%
Note: Volume = total volume. Take rate = total revenue divided by volume.
Paysafe: (d. EBITDA and FCF are non-GAAP financial measures. See the appendix of this presentation for a reconciliation to the most directly comparable GAAP financial measures.
(2) The sale of Pay Later was announced in July of 2020 and closed in October 2020. In the first quarter of 2020, Pay Later generated revenue and Adj. EBITDA of approximately $7.1m and $1.3m, respectively.
7View entire presentation