Origin SPAC Presentation Deck
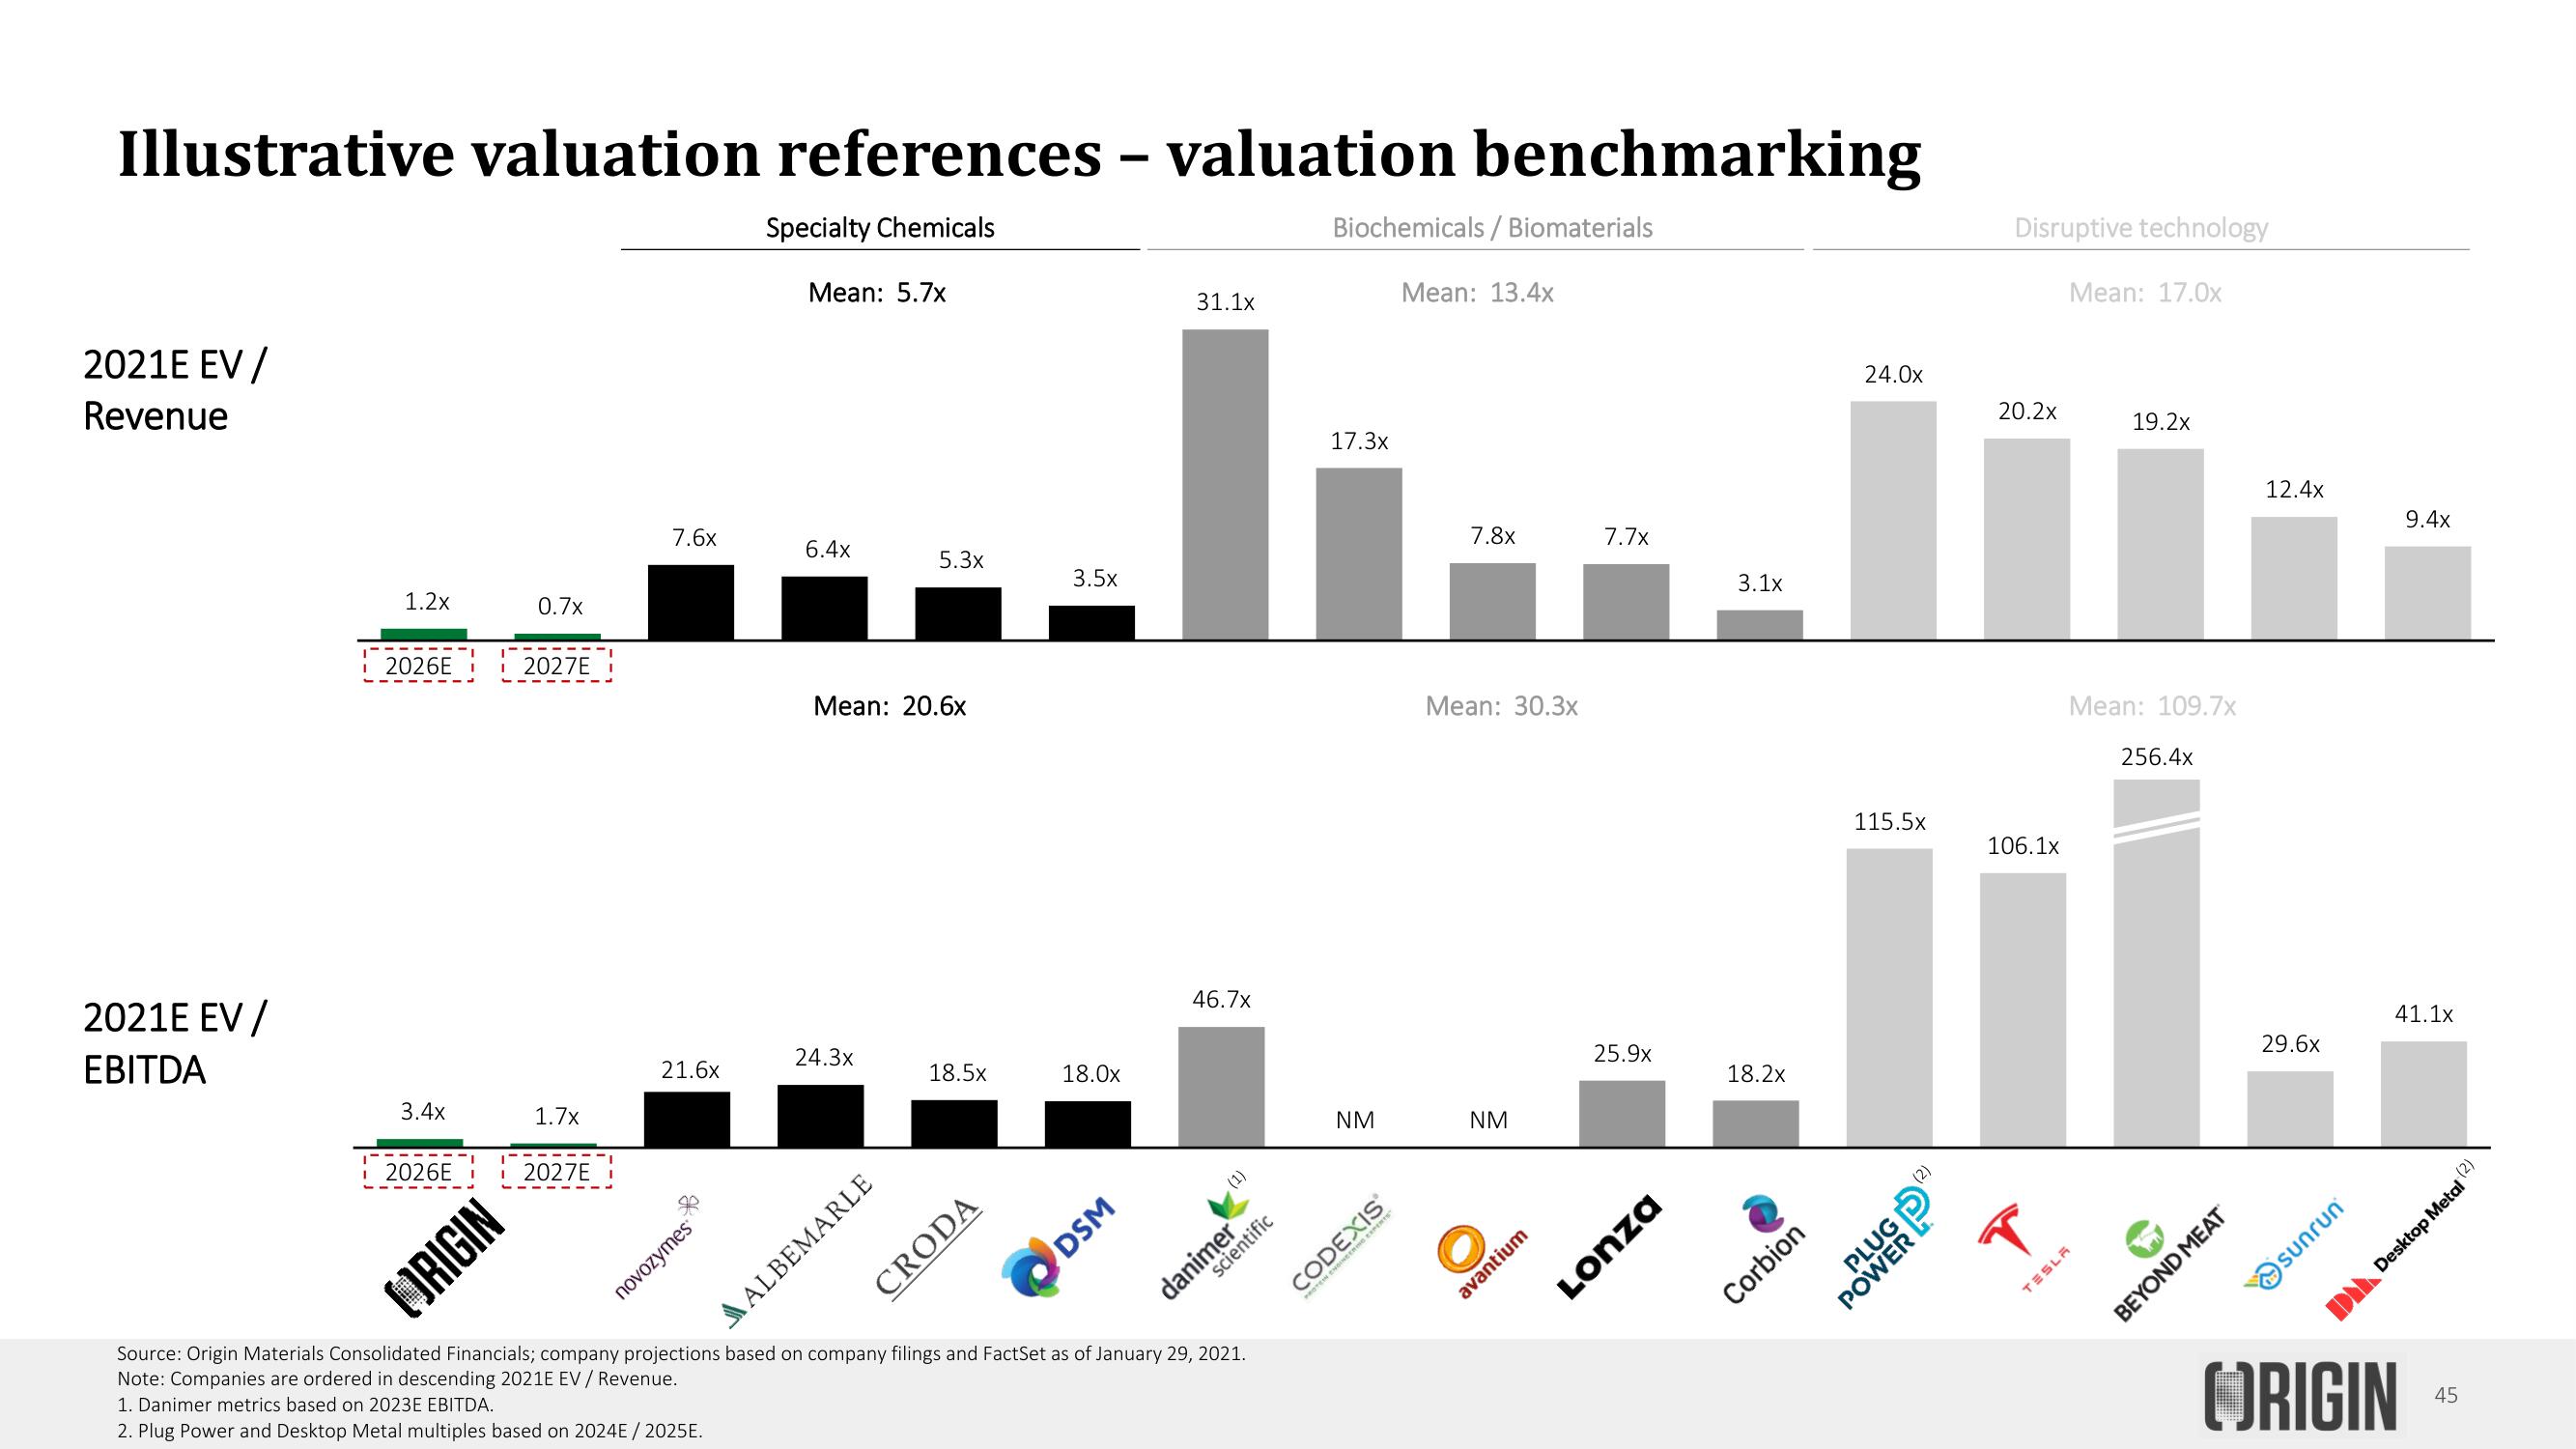
Illustrative valuation references - valuation benchmarking
Specialty Chemicals
2021E EV/
Revenue
2021E EV /
EBITDA
1.2x
i 2026E i i 2027E i
3.4x
i 2026E
0.7x
ORIGIN
1.7x
1-
i 2027E
7.6x
21.6x
novozymes
Mean: 5.7x
6.4x
Mean: 20.6x
24.3x
5.3x
ALBEMARLE
18.5x
CRODA
3.5x
18.0x
DSM
31.1x
46.7x
danimer (¹)
Source: Origin Materials Consolidated Financials; company projections based on company filings and FactSet as of January 29, 2021.
Note: Companies are ordered in descending 2021E EV / Revenue.
1. Danimer metrics based on 2023E EBITDA.
2. Plug Power and Desktop Metal multiples based on 2024E / 2025E.
Biochemicals/Biomaterials
17.3x
NM
Mean: 13.4x
7.8x
Mean: 30.3x
NM
O
7.7x
avar
25.9x
3.1x
18.2x
24.0x
Corbion
115.5x
Disruptive technology
POWG
20.2x
106.1x
Mean: 17.0x
صورت به سی امن میں لیا
19.2x
Mean: 109.7x
256.4x
12.4x
29.6x
sunrun
9.4x
41.1x
ORIGIN
45
D Desktop Metal (2)View entire presentation