Melrose Results Presentation Deck
Aerospace: highlights
Melrose
£m
Revenue
EBITDA
EBITDA margin %
Operating profit
Operating margin %
■
■
I
Buy
Improve
Sell
2020
Adjusted¹ results
2,804
163
1.
2.
3.
4.
5.8%
14
0.5%
Highlights
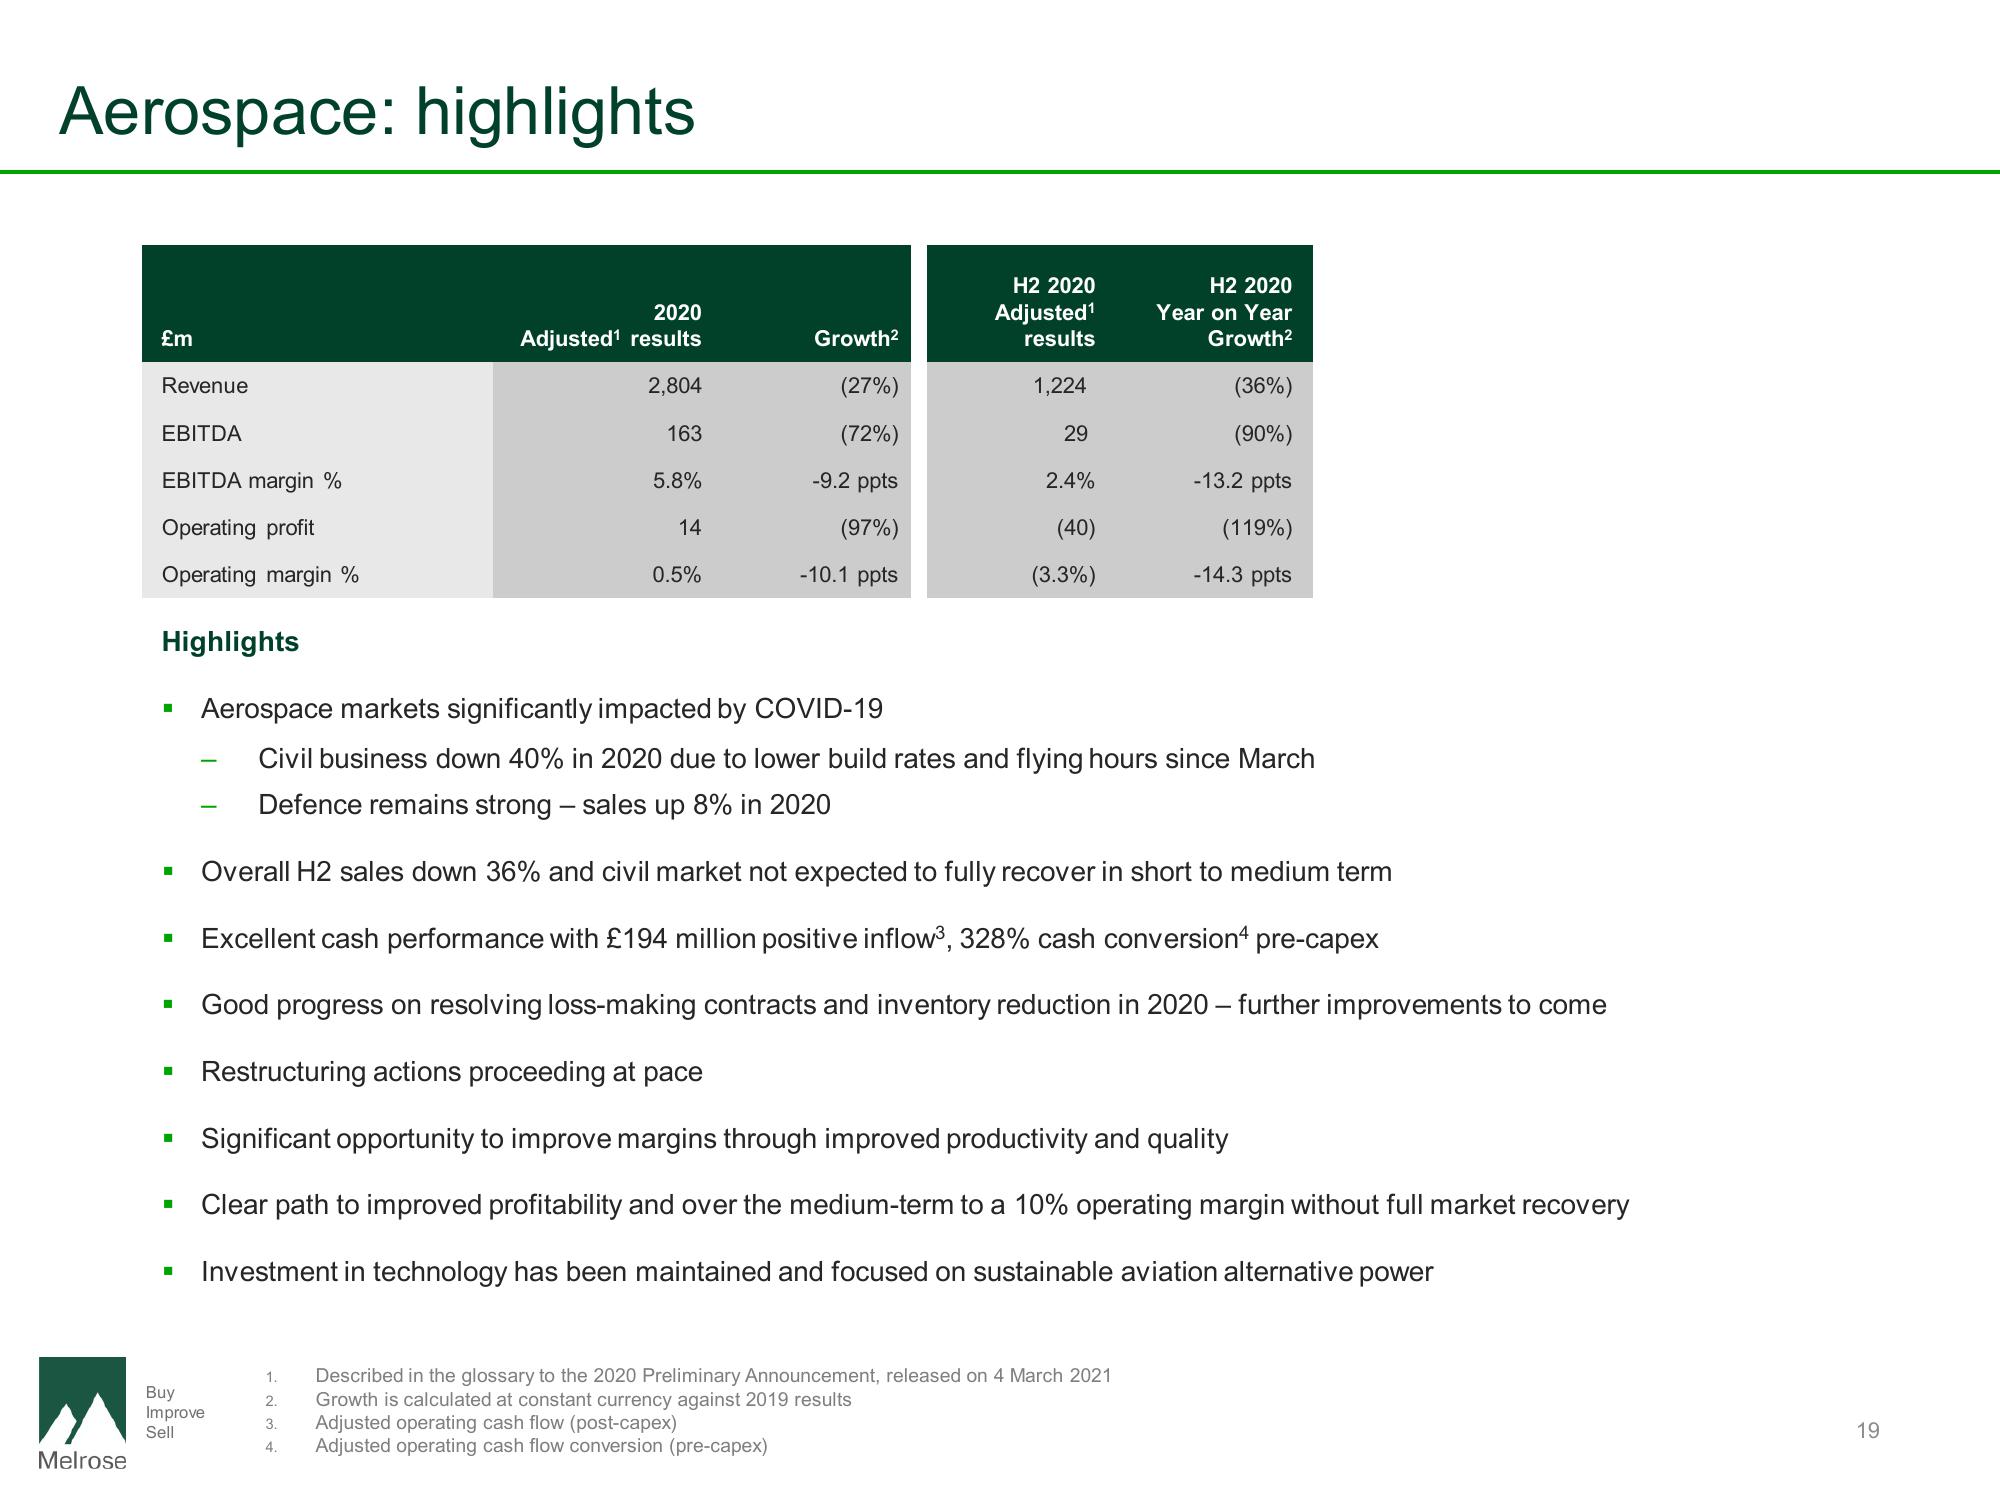
Aerospace markets significantly impacted by COVID-19
Civil business down 40% in 2020 due to lower build rates and flying hours since March
Defence remains strong - sales up 8% in 2020
Overall H2 sales down 36% and civil market not expected to fully recover in short to medium term
Excellent cash performance with £194 million positive inflow³, 328% cash conversion 4 pre-capex
Good progress on resolving loss-making contracts and inventory reduction in 2020 - further improvements to come
Restructuring actions proceeding at pace
Significant opportunity to improve margins through improved productivity and quality
Clear path to improved profitability and over the medium-term to a 10% operating margin without full market recovery
Investment in technology has been maintained and focused on sustainable aviation alternative power
Growth²
(27%)
(72%)
-9.2 ppts
(97%)
-10.1 ppts
H2 2020
Adjusted¹
results
1,224
29
2.4%
(40)
(3.3%)
H2 2020
Year on Year
Growth²
Described in the glossary to the 2020 Preliminary Announcement, released on 4 March 2021
Growth is calculated at constant currency against 2019 results
Adjusted operating cash flow (post-capex)
Adjusted operating cash flow conversion (pre-capex)
(36%)
(90%)
-13.2 ppts
(119%)
-14.3 ppts
19View entire presentation