Main Street Capital Investor Day Presentation Deck
Historical Performance & Valuation
(Equity Cost and FV $ in millions)
$20.0
$15.0
$10.0
$5.0
$0.0
$2.0 $2.0
Transaction
Date
$2.0
$3.0
w
*********
**
****
22222
*xxx
Dec-19
Equity Cost ($)
$2.0
$6.8
Hot
Dec-20
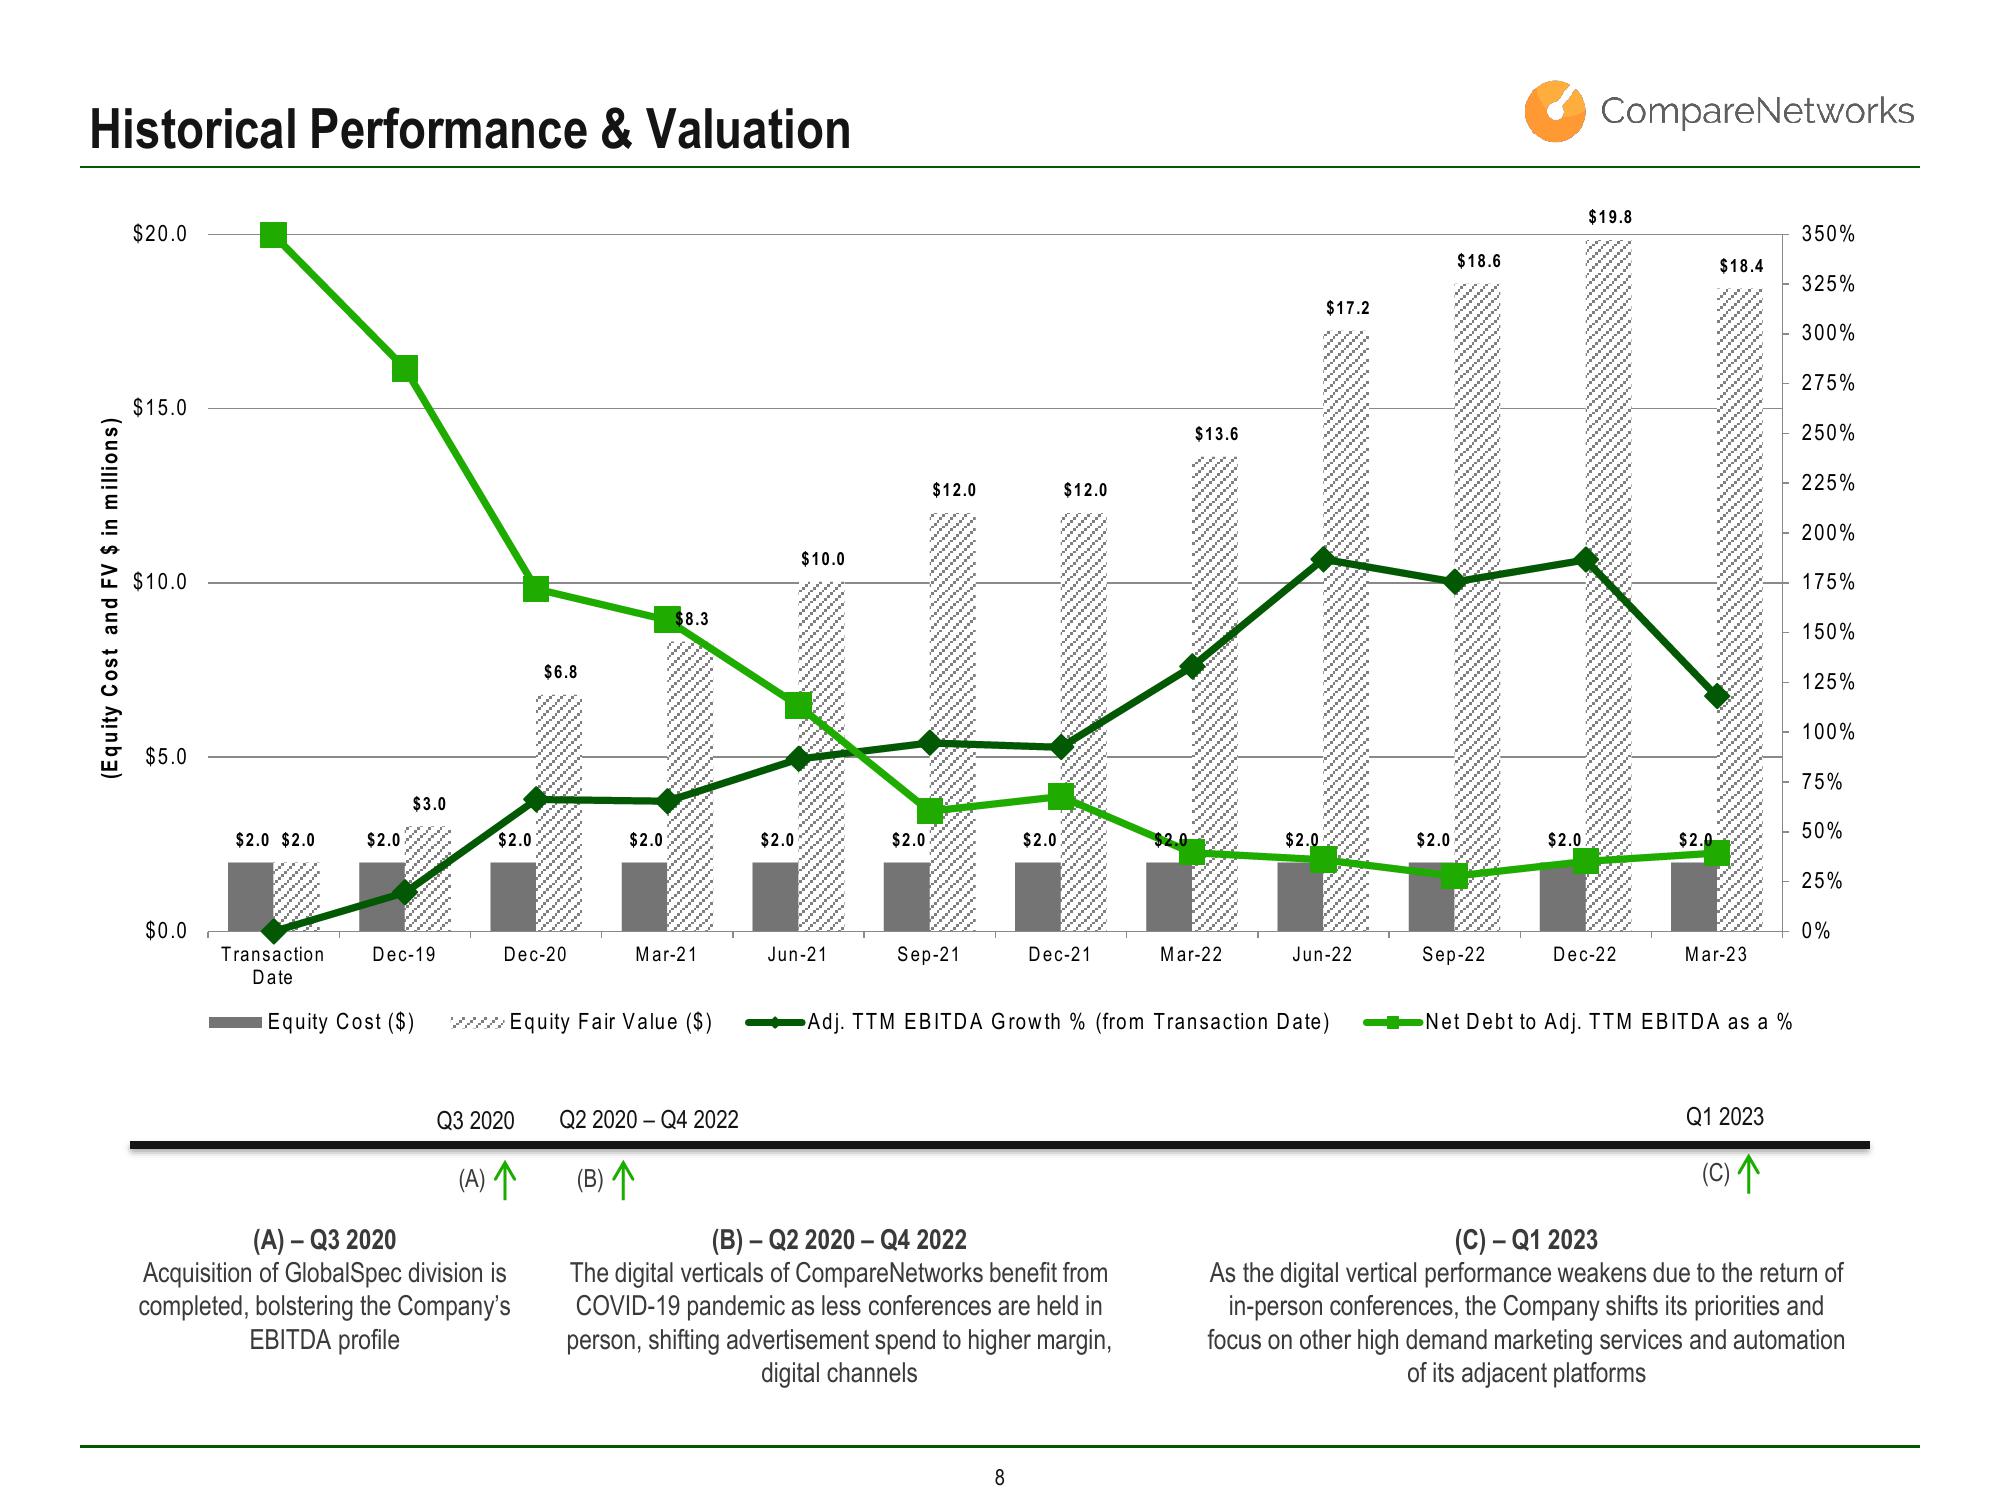
(A) -Q3 2020
Acquisition of GlobalSpec division is
completed, bolstering the Company's
EBITDA profile
......
****
$2.0
$8.3
Mar-21
www.Equity Fair Value ($)
Q3 2020 Q2 2020-Q4 2022
(A) 个
(B) 个
$2.0
$10.0
********
Jun-21
********
*********
$12.0
$2.0
+5
******
M
Sep-21
*****
******
******
********
$2.0
$12.0
8
M
..........
.....
*******
*****.....
******
bemor
****
*********
Dec-21
www.
(B)-Q2 2020-Q4 2022
The digital verticals of Compare Networks benefit from
COVID-19 pandemic as less conferences are held in
person, shifting advertisement spend to higher margin,
digital channels
$13.6
*****
-2222
*****
******
*********
*xx.
****
************
Mar-22
*******
wwwwww
n****
www
with
*****
$2.0
$17.2
***
WAY.
Adj. TTM EBITDA Growth % (from Transaction Date)
*****
Jun-22
***.....
....…....
$18.6
$2.0
*****
MS JE
*****
******
******
Sep-22
*******
.........
$2.0
$19.8
M
CompareNetworks
9.15.00
****
.......
trees w
******..
*******
b
www.
Dec-22
$2.0
$18.4
Mar-23
Net Debt to Adj. TTM EBITDA as a %
Q1 2023
(C)个
350%
325%
300%
275%
250%
225%
200%
175%
150%
125%
100%
75%
50%
25%
0%
(C) - Q1 2023
As the digital vertical performance weakens due to the return of
in-person conferences, the Company shifts its priorities and
focus on other high demand marketing services and automation
of its adjacent platformsView entire presentation