BlackRock Results Presentation Deck
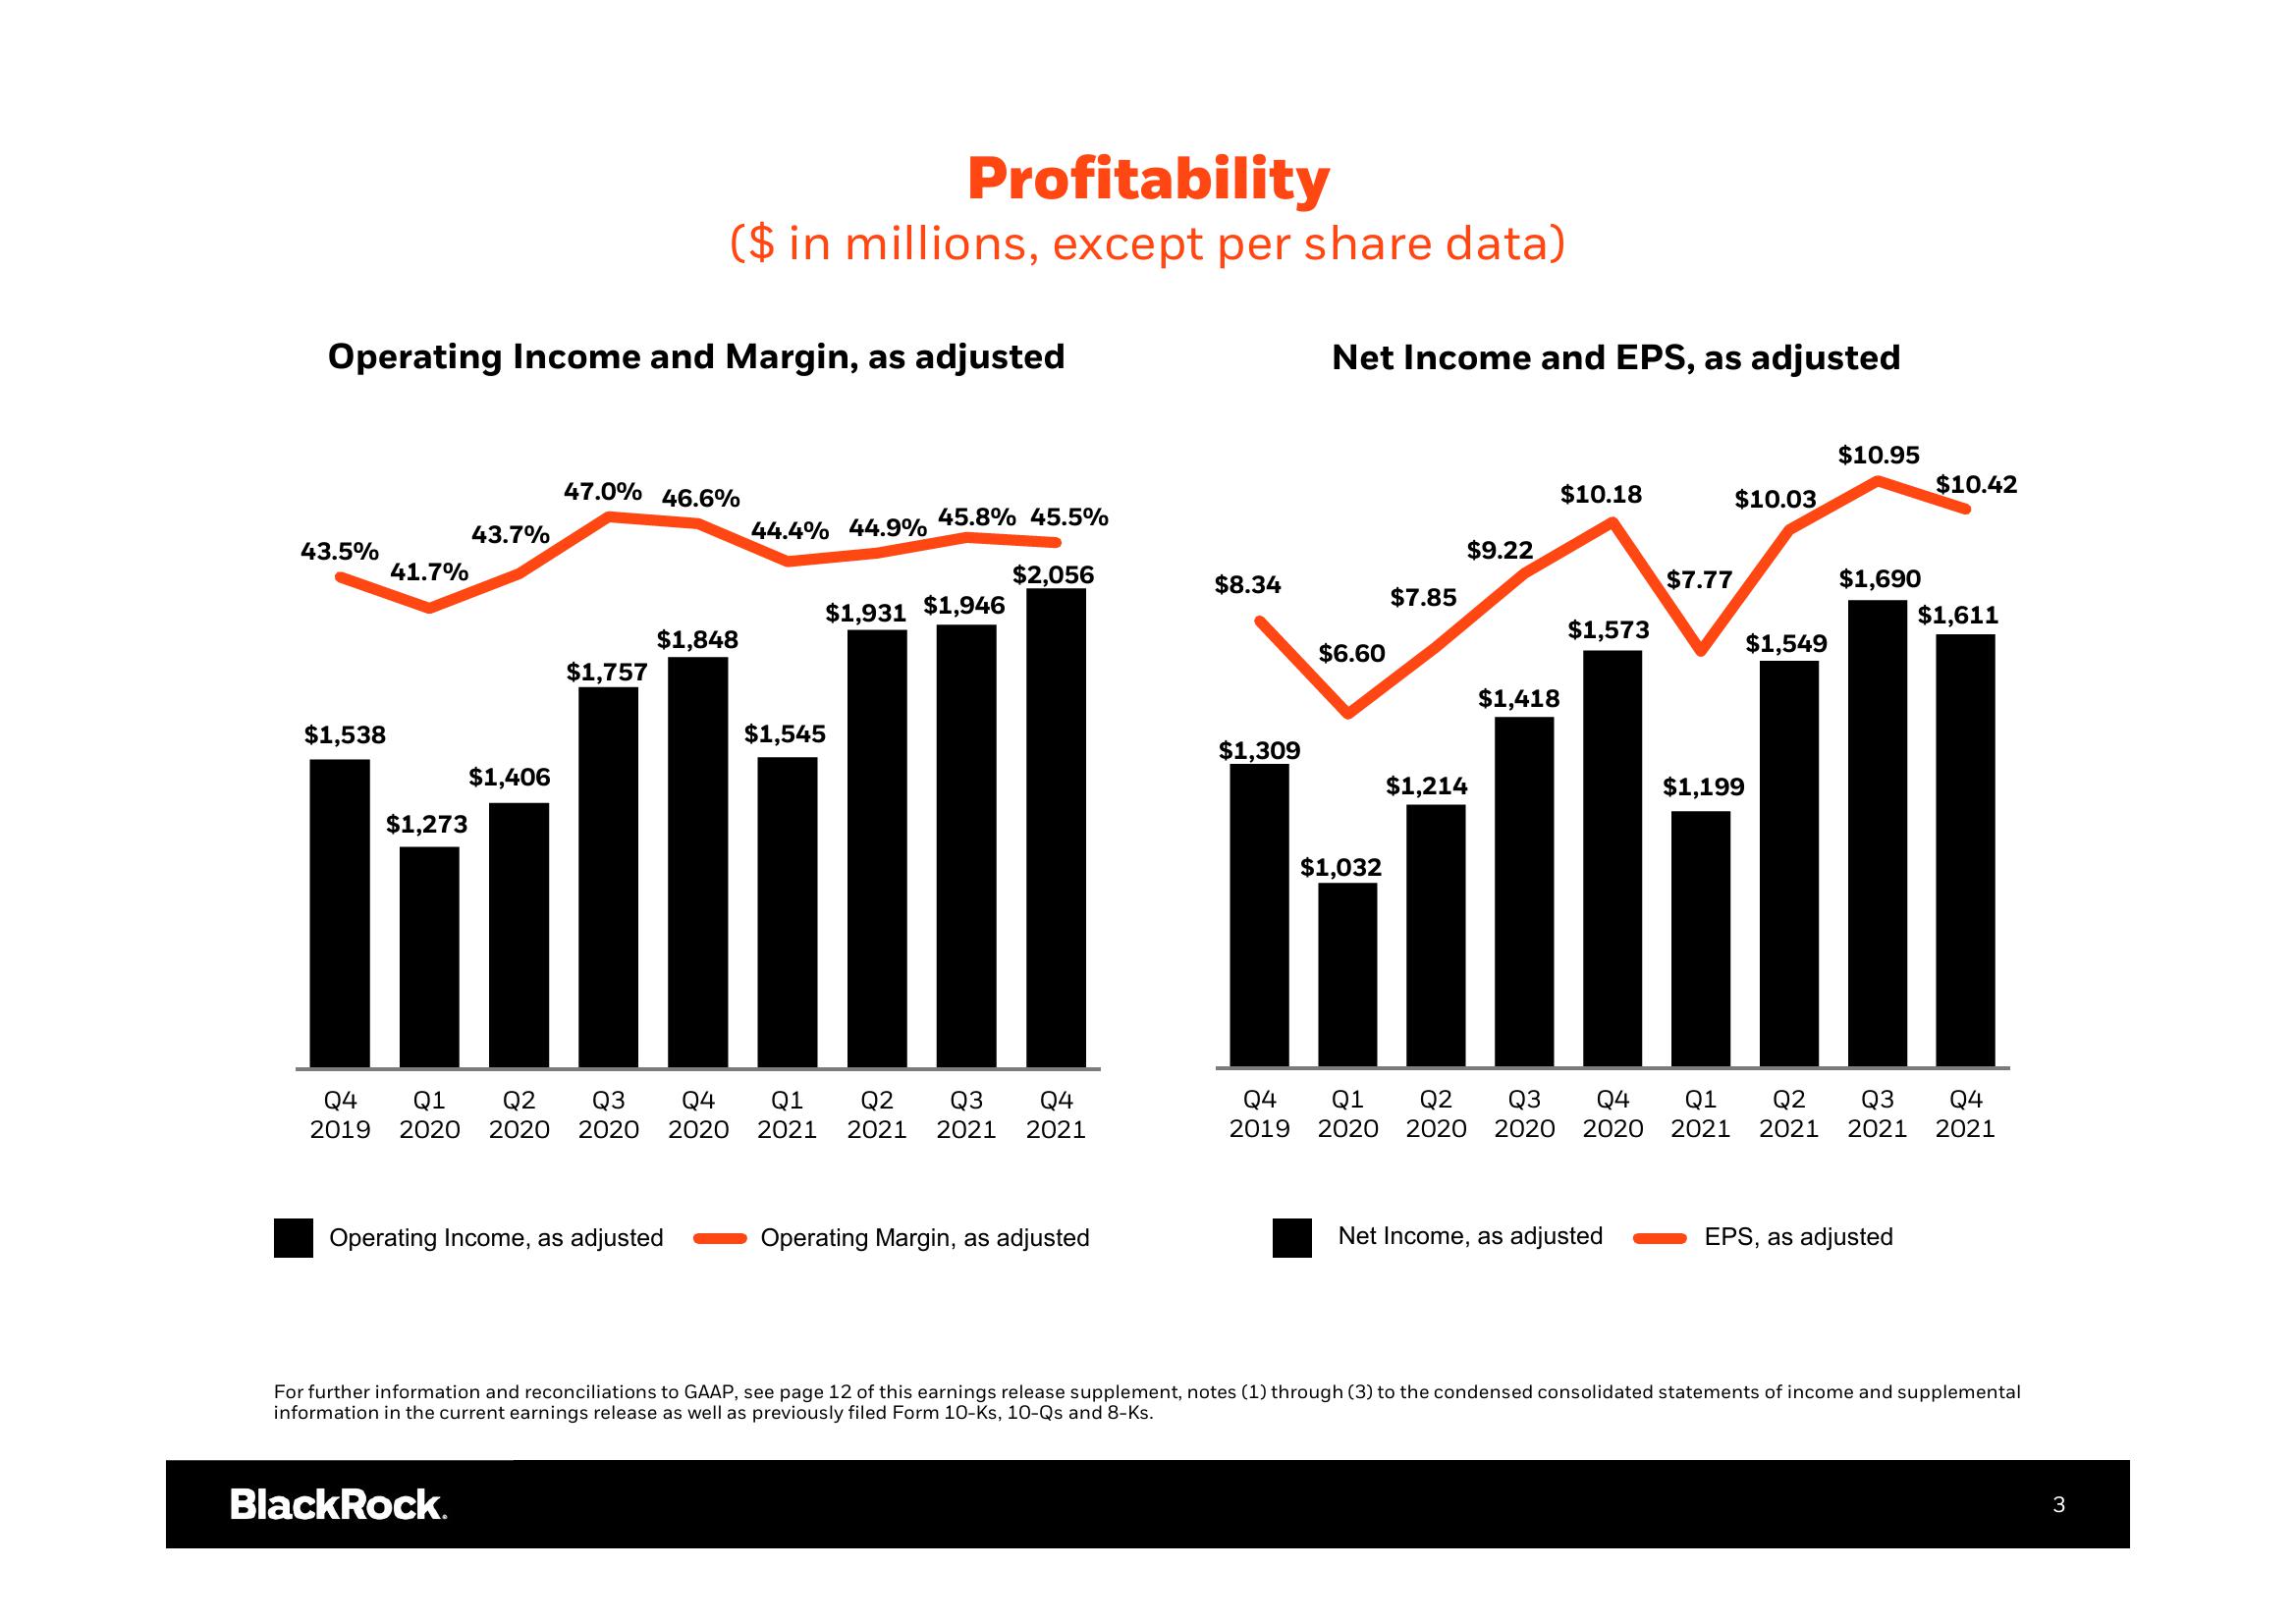
Operating Income and Margin, as adjusted
43.5%
$1,538
41.7%
Q4
2019
$1,273
43.7%
$1,406
اللباس
47.0% 46.6%
BlackRock.
Profitability
($ in millions, except per share data)
$1,757
Q1
Q2 Q3 Q4
2020 2020 2020 2020
$1,848
Operating Income, as adjusted
44.4% 44.9%
45.8% 45.5%
$1,931 $1,946
$1,545
$2,056
01 Q2 Q3
2021 2021 2021
Q4
2021
Operating Margin, as adjusted
$8.34
$1,309
Net Income and EPS, as adjusted
$6.60
$1,032
$7.85
$9.22
$1,214
$10.18
$1,418
$1,573
Q4
Q1 Q2 Q3 Q4
2019 2020 2020 2020 2020
Net Income, as adjusted
$7.77
$10.03
$1,199
Q1
2021
$1,549
$10.95
$1,690
$10.42
EPS, as adjusted
$1,611
Q2 03 Q4
2021 2021 2021
For further information and reconciliations to GAAP, see page 12 of this earnings release supplement, notes (1) through (3) to the condensed consolidated statements of income and supplemental
information in the current earnings release as well as previously filed Form 10-Ks, 10-Qs and 8-Ks.
3View entire presentation