Hydrafacial Results Presentation Deck slide image

Hydrafacial Results Presentation Deck

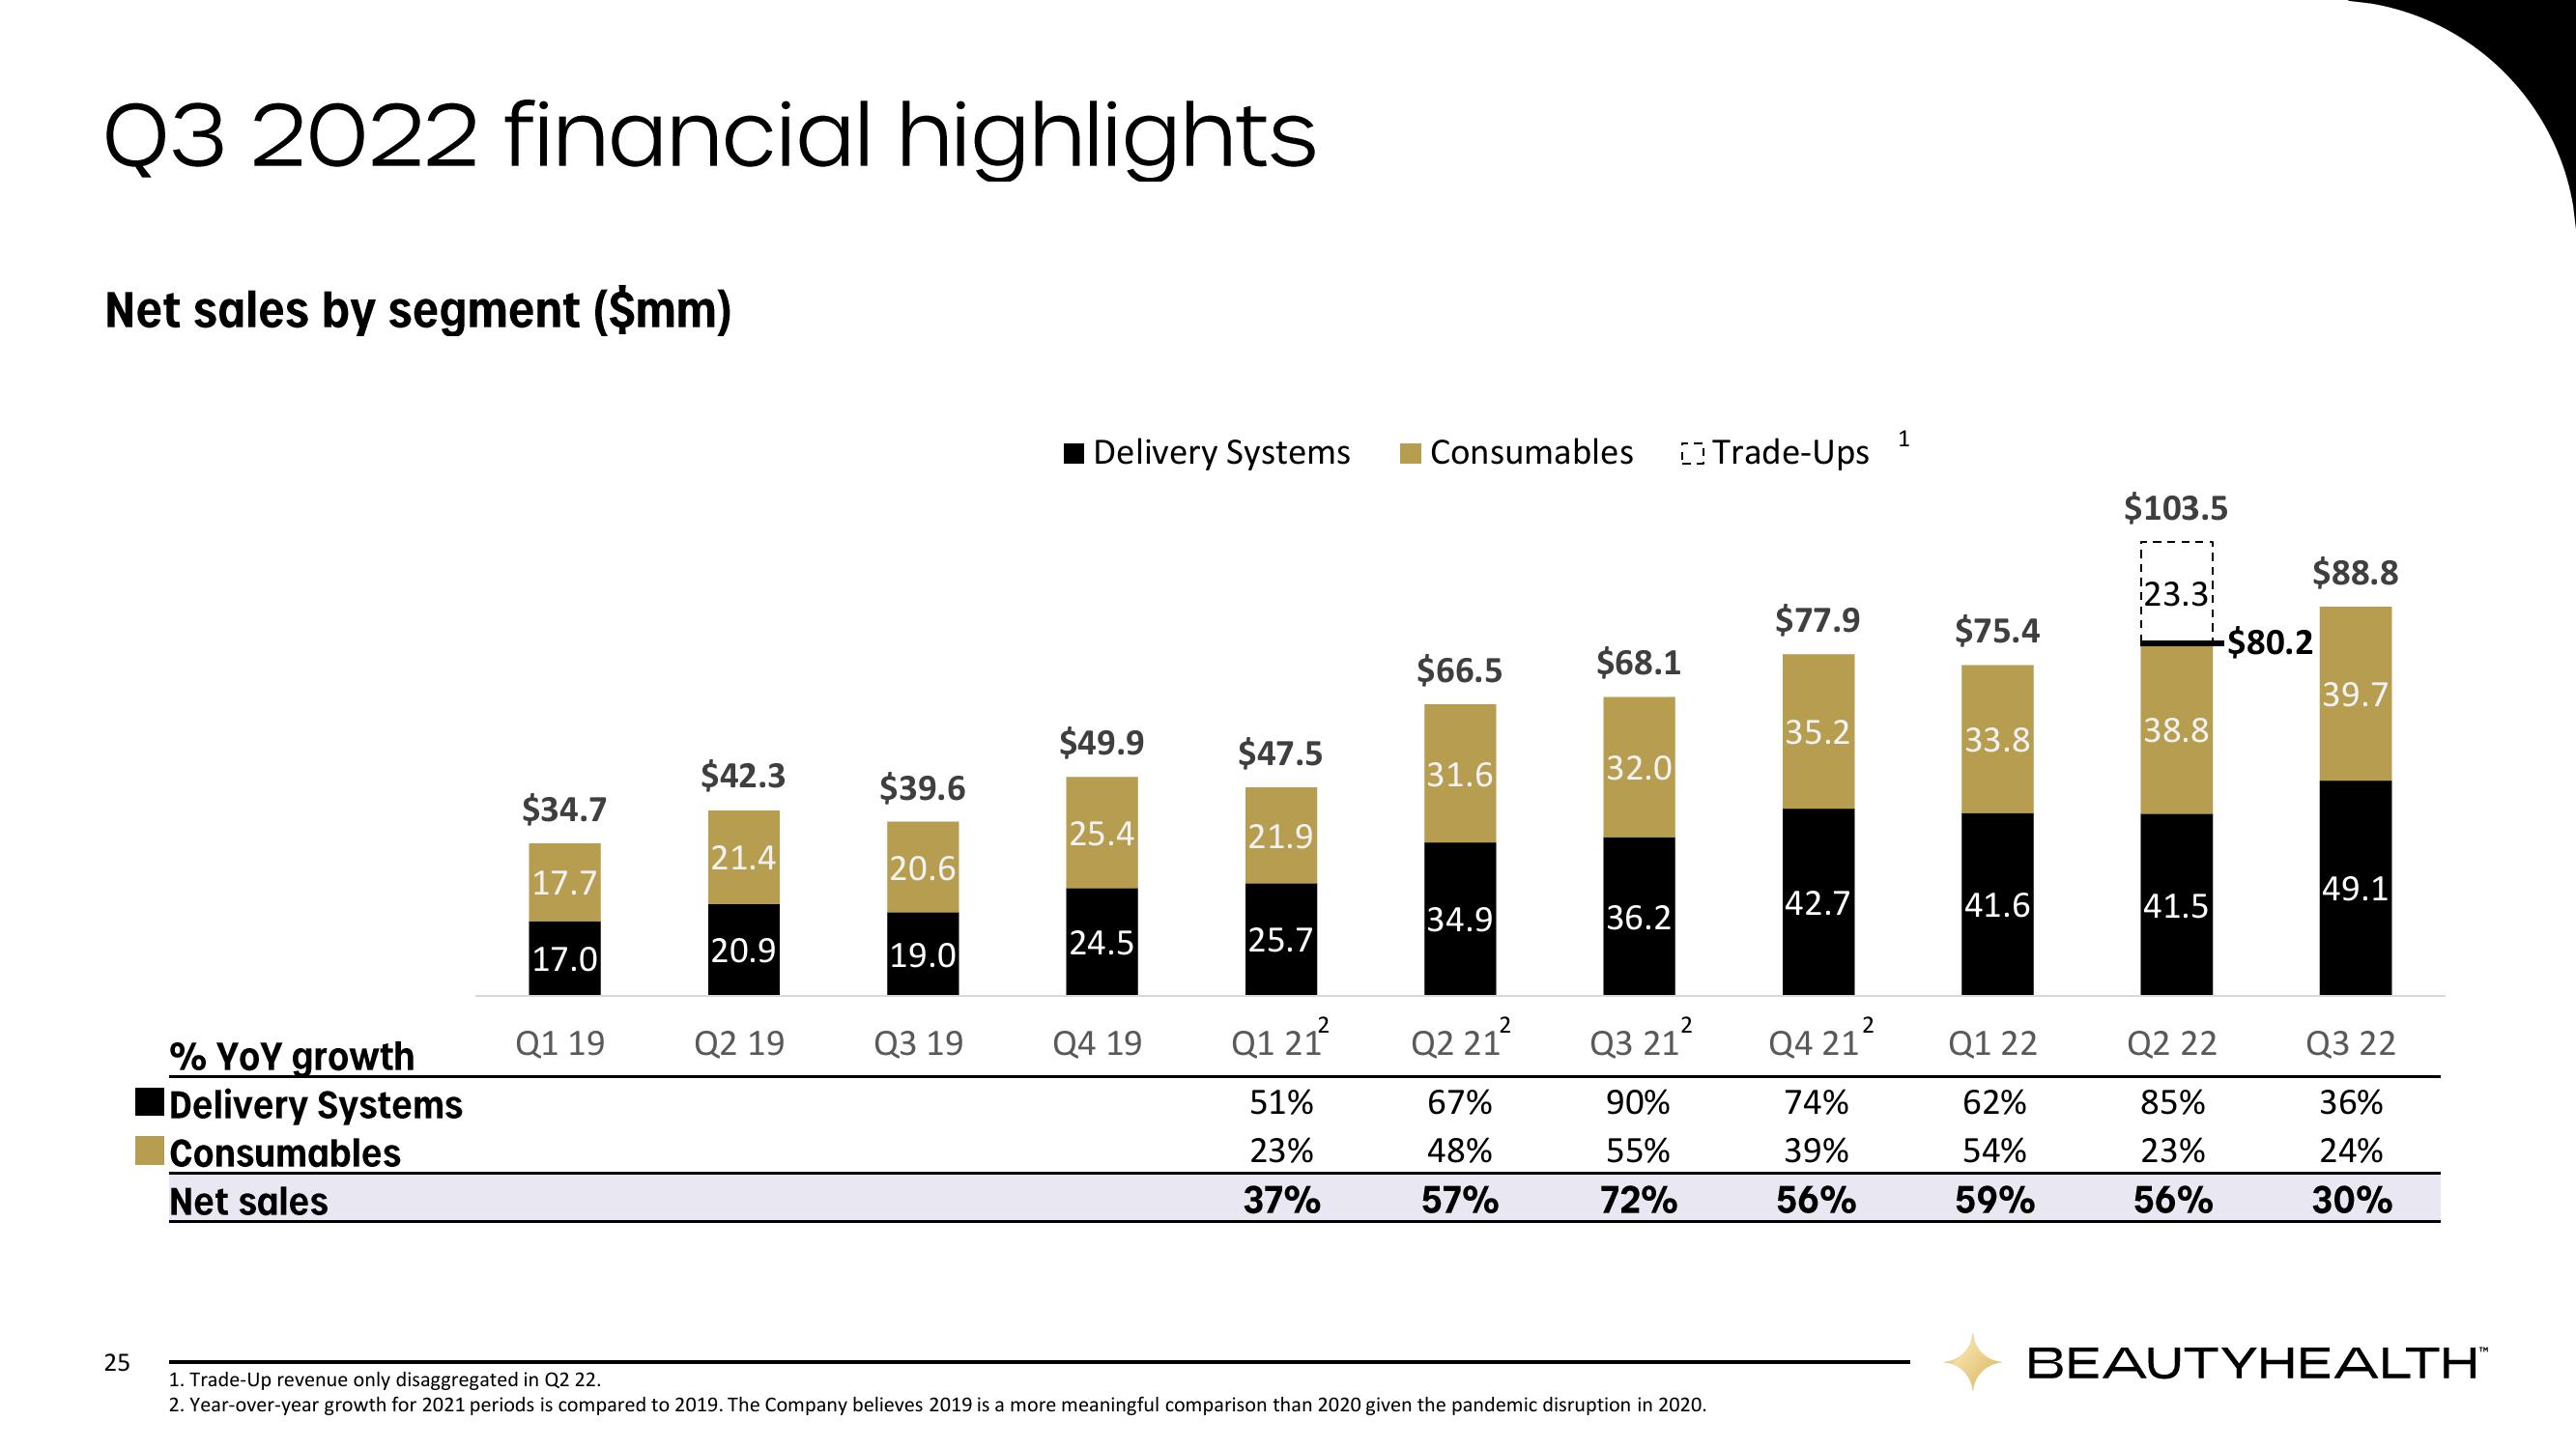
Q3 2022 financial highlights Net sales by segment ($mm) 25 % YoY growth Delivery Systems Consumables Net sales $34.7 17.7 17.0 Q1 19 $42.3 21.4 20.9 Q2 19 $39.6 20.6 19.0 Q3 19 Delivery Systems $49.9 25.4 24.5 Q4 19 $47.5 21.9 25.7 Q1 21² 51% 23% 37% Consumables Trade-Ups $66.5 $68.1 31.6 34.9 Q2 21² 67% 48% 57% 32.0 36.2 2 Q3 21² 90% 55% 72% 1. Trade-Up revenue only disaggregated in Q2 22. 2. Year-over-year growth for 2021 periods is compared to 2019. The Company believes 2019 is a more meaningful comparison than 2020 given the pandemic disruption in 2020. $77.9 35.2 42.7 Q4 21 74% 39% 56% 2 1 $75.4 33.8 41.6 Q1 22 62% 54% 59% $103.5 23.3 I -$80.2 38.8 41.5 $88.8 Q2 22 85% 23% 56% 39.7 49.1 Q3 22 36% 24% 30% BEAUTYHEALTH™
View entire presentation