SmileDirectClub Investor Presentation Deck
Marketing & selling.
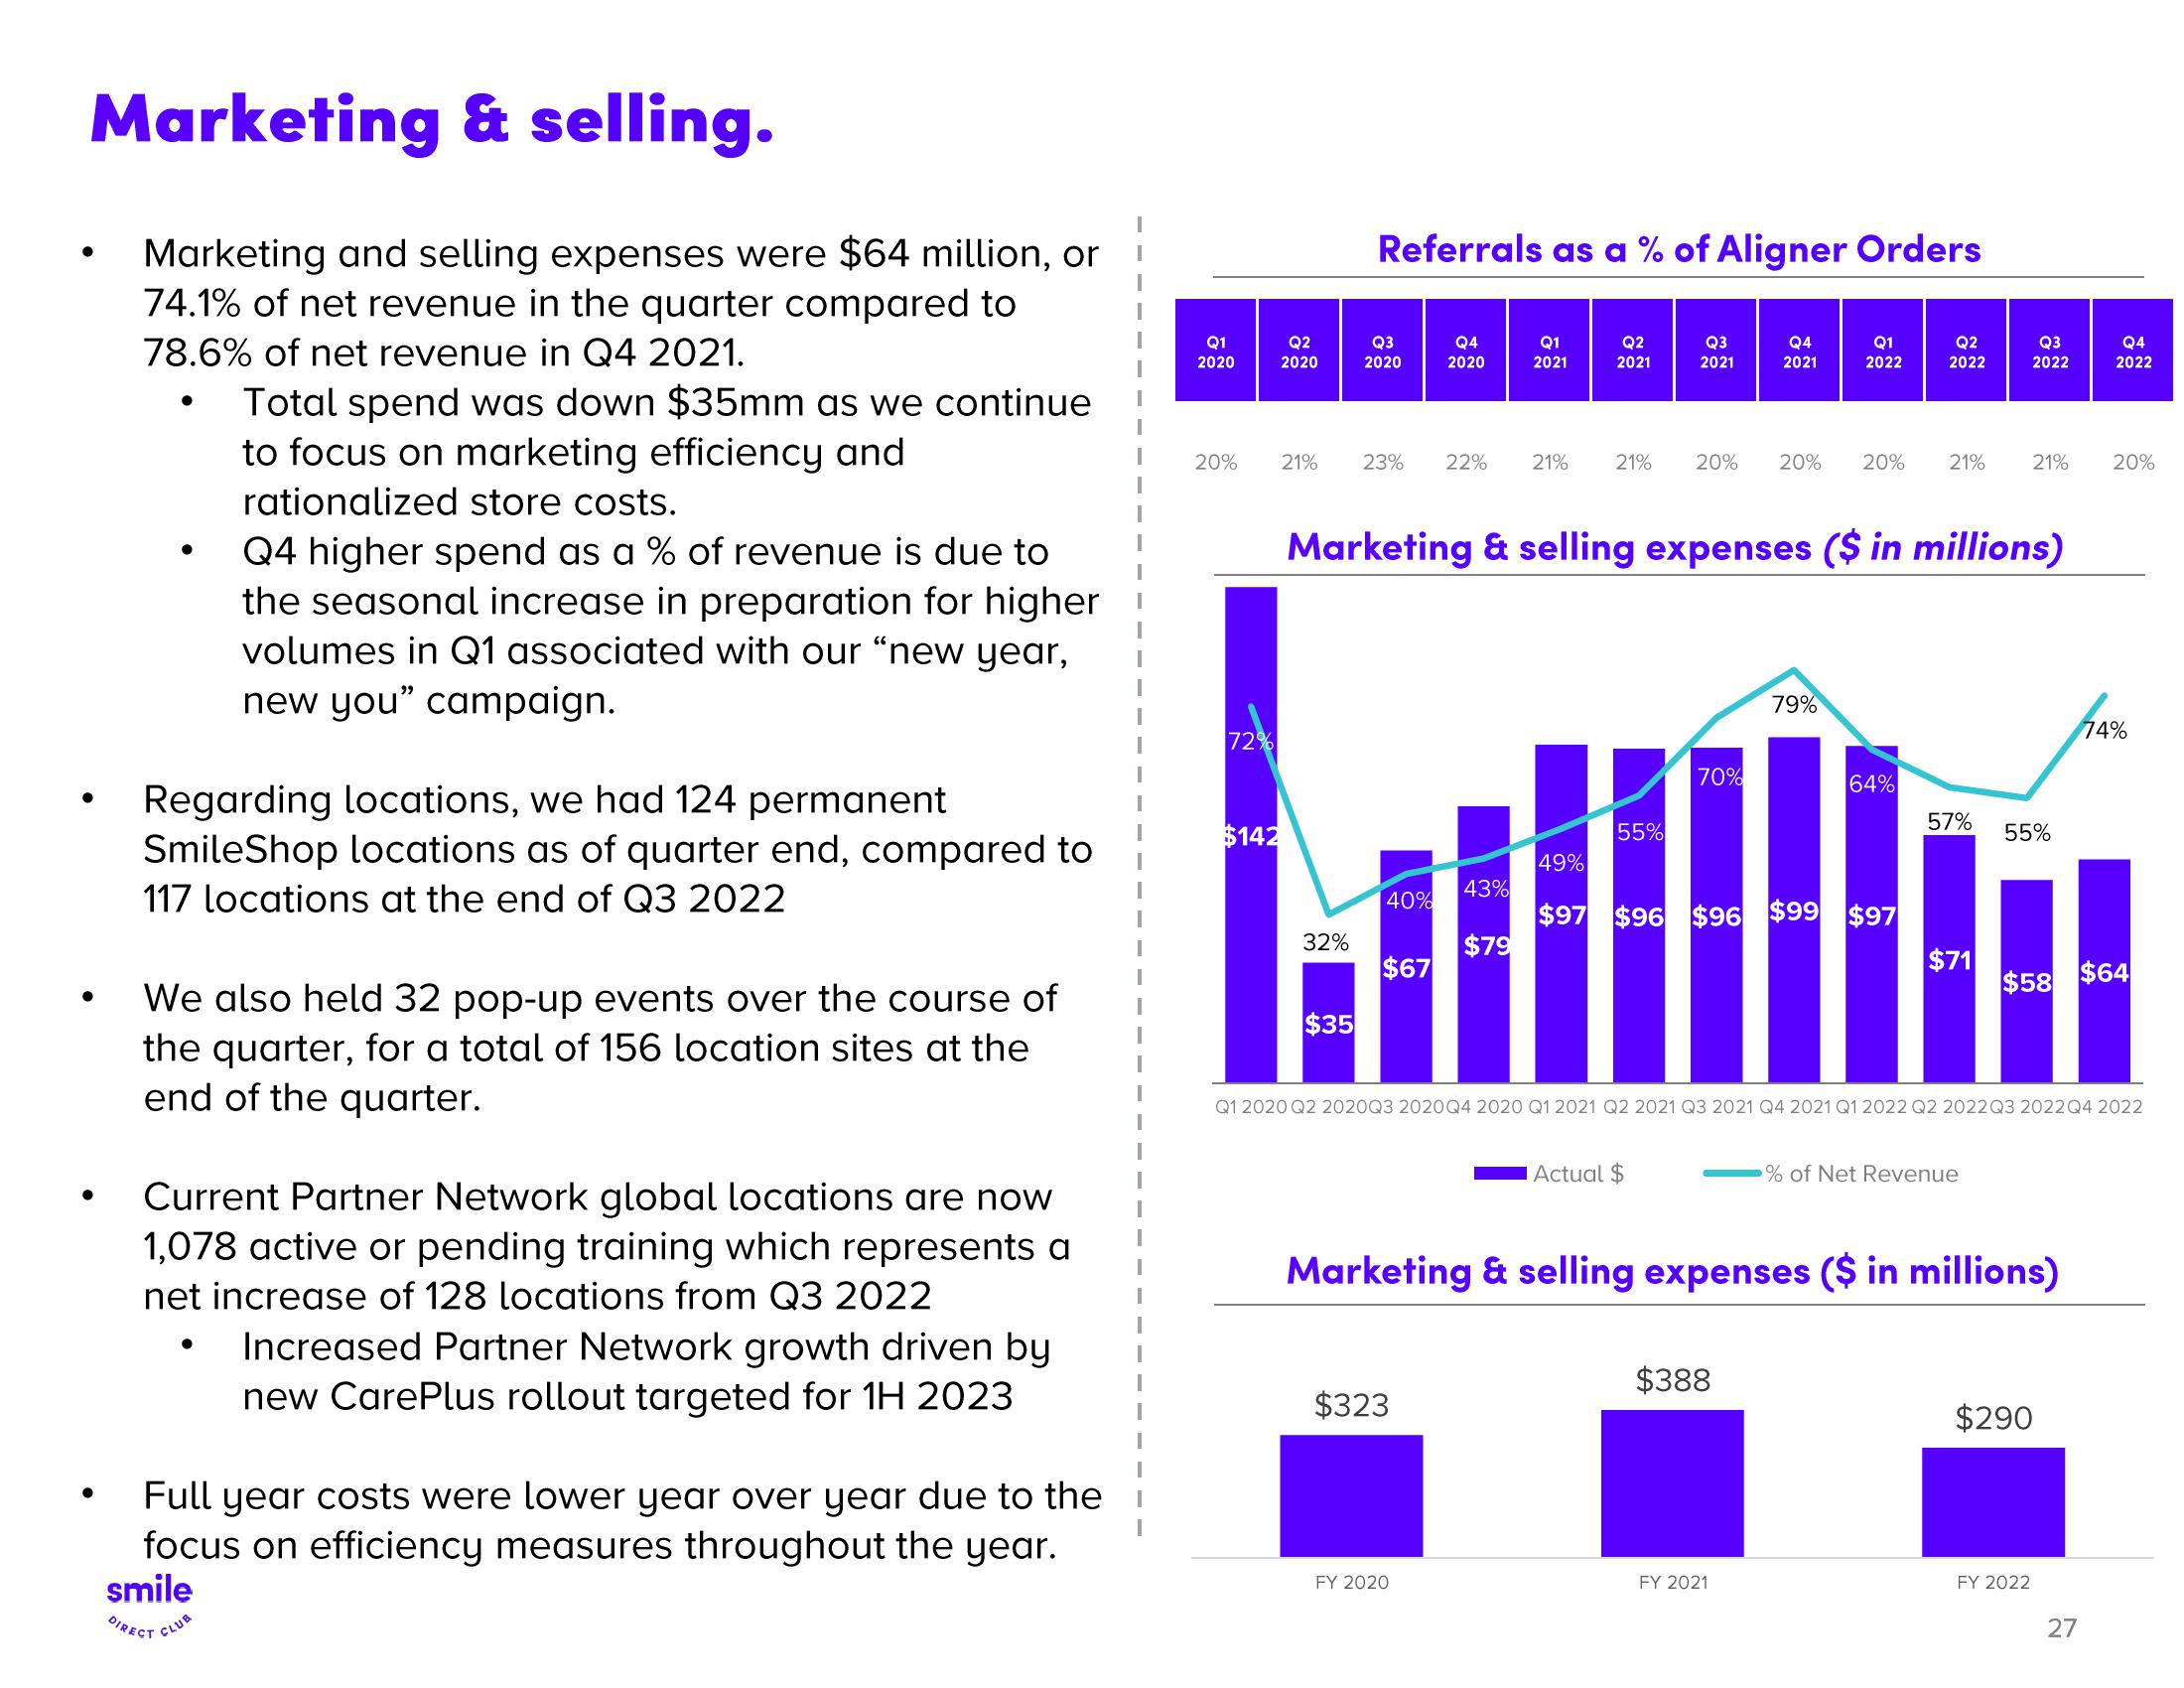
Marketing and selling expenses were $64 million, or
74.1% of net revenue in the quarter compared to
78.6% of net revenue in Q4 2021.
●
Total spend was down $35mm as we continue
to focus on marketing efficiency and
rationalized store costs.
Q4 higher spend as a % of revenue is due to
the seasonal increase in preparation for higher
volumes in Q1 associated with our "new year,
new you" campaign.
Regarding locations, we had 124 permanent
SmileShop locations as of quarter end, compared to
117 locations at the end of Q3 2022
We also held 32 pop-up events over the course of
the quarter, for a total of 156 location sites at the
end of the quarter.
Current Partner Network global locations are now
1,078 active or pending training which represents a
net increase of 128 locations from Q3 2022
Increased Partner Network growth driven by
new CarePlus rollout targeted for 1H 2023
Full year costs were lower year over year due to the
focus on efficiency measures throughout the year.
smile
DIRECT CLUB
Q1
2020
Q2
2020
72%
$142
20% 21% 23% 22% 21%
Referrals as a % of Aligner Orders
Q4
2020
32%
Q3
2020
$35
40%
$67
Q1
2021
43%
$323
$79
FY 2020
Q2
2021
21%
Marketing & selling expenses ($ in millions)
55%
Q3
2021
Actual $
20% 20% 20%
70%
Q4
2021
Q1
2022
79%
49%
$97 $96 $96 $99 $97
$388
FY 2021
64%
Q2
2022
21%
57%
$71
Q3
2022
% of Net Revenue
21%
Q1 2020 Q2 2020Q3 2020Q4 2020 Q1 2021 Q2 2021 Q3 2021 Q4 2021 Q1 2022 Q2 2022Q3 2022 Q4 2022
Marketing & selling expenses ($ in millions)
55%
FY 2022
$58 $64
$290
Q4
2022
20%
27
74%View entire presentation