PropertyGuru SPAC Presentation Deck
Group Adjusted EBITDA Before HQ Costs(1)
35
US$m
Total
HQ Costs
Adjusted
EBITDA
26.8
4.2
25.1
(2.5)
(0.0)
CY19A
(17.4)
9.4(2)
Singapore
20% CAGR
31% CAGR
9% CAGR
Vietnam
55.7
5.2
12.3
35.7
CY23F
(29.8)
25.9
Malaysia
2.4
0.2
40% CAGR
38% CAGR
18% CAGR
Other Asia
(3)
109.3
10.1
4.1
21.8
23.3
49.9
CY25F
(36.1)
73.1
Data & FinTech
Note: USDSGD FX rate of 1:1.327
(1) Adjusted EBITDA Before HQ Costs excludes HQ costs, SBP, costs of REA acquisition & integration, one-off & ongoing costs of listing, as well as impact from Listing proceeds investments. Refer to slide 44 for CY19A & CY20A reconciliation to net loss
(2) Please refer to slide 44 for reconciliation from net income
(3)
Includes Adjusted EBITDA from Thailand and Indonesia
(4)
Estimated
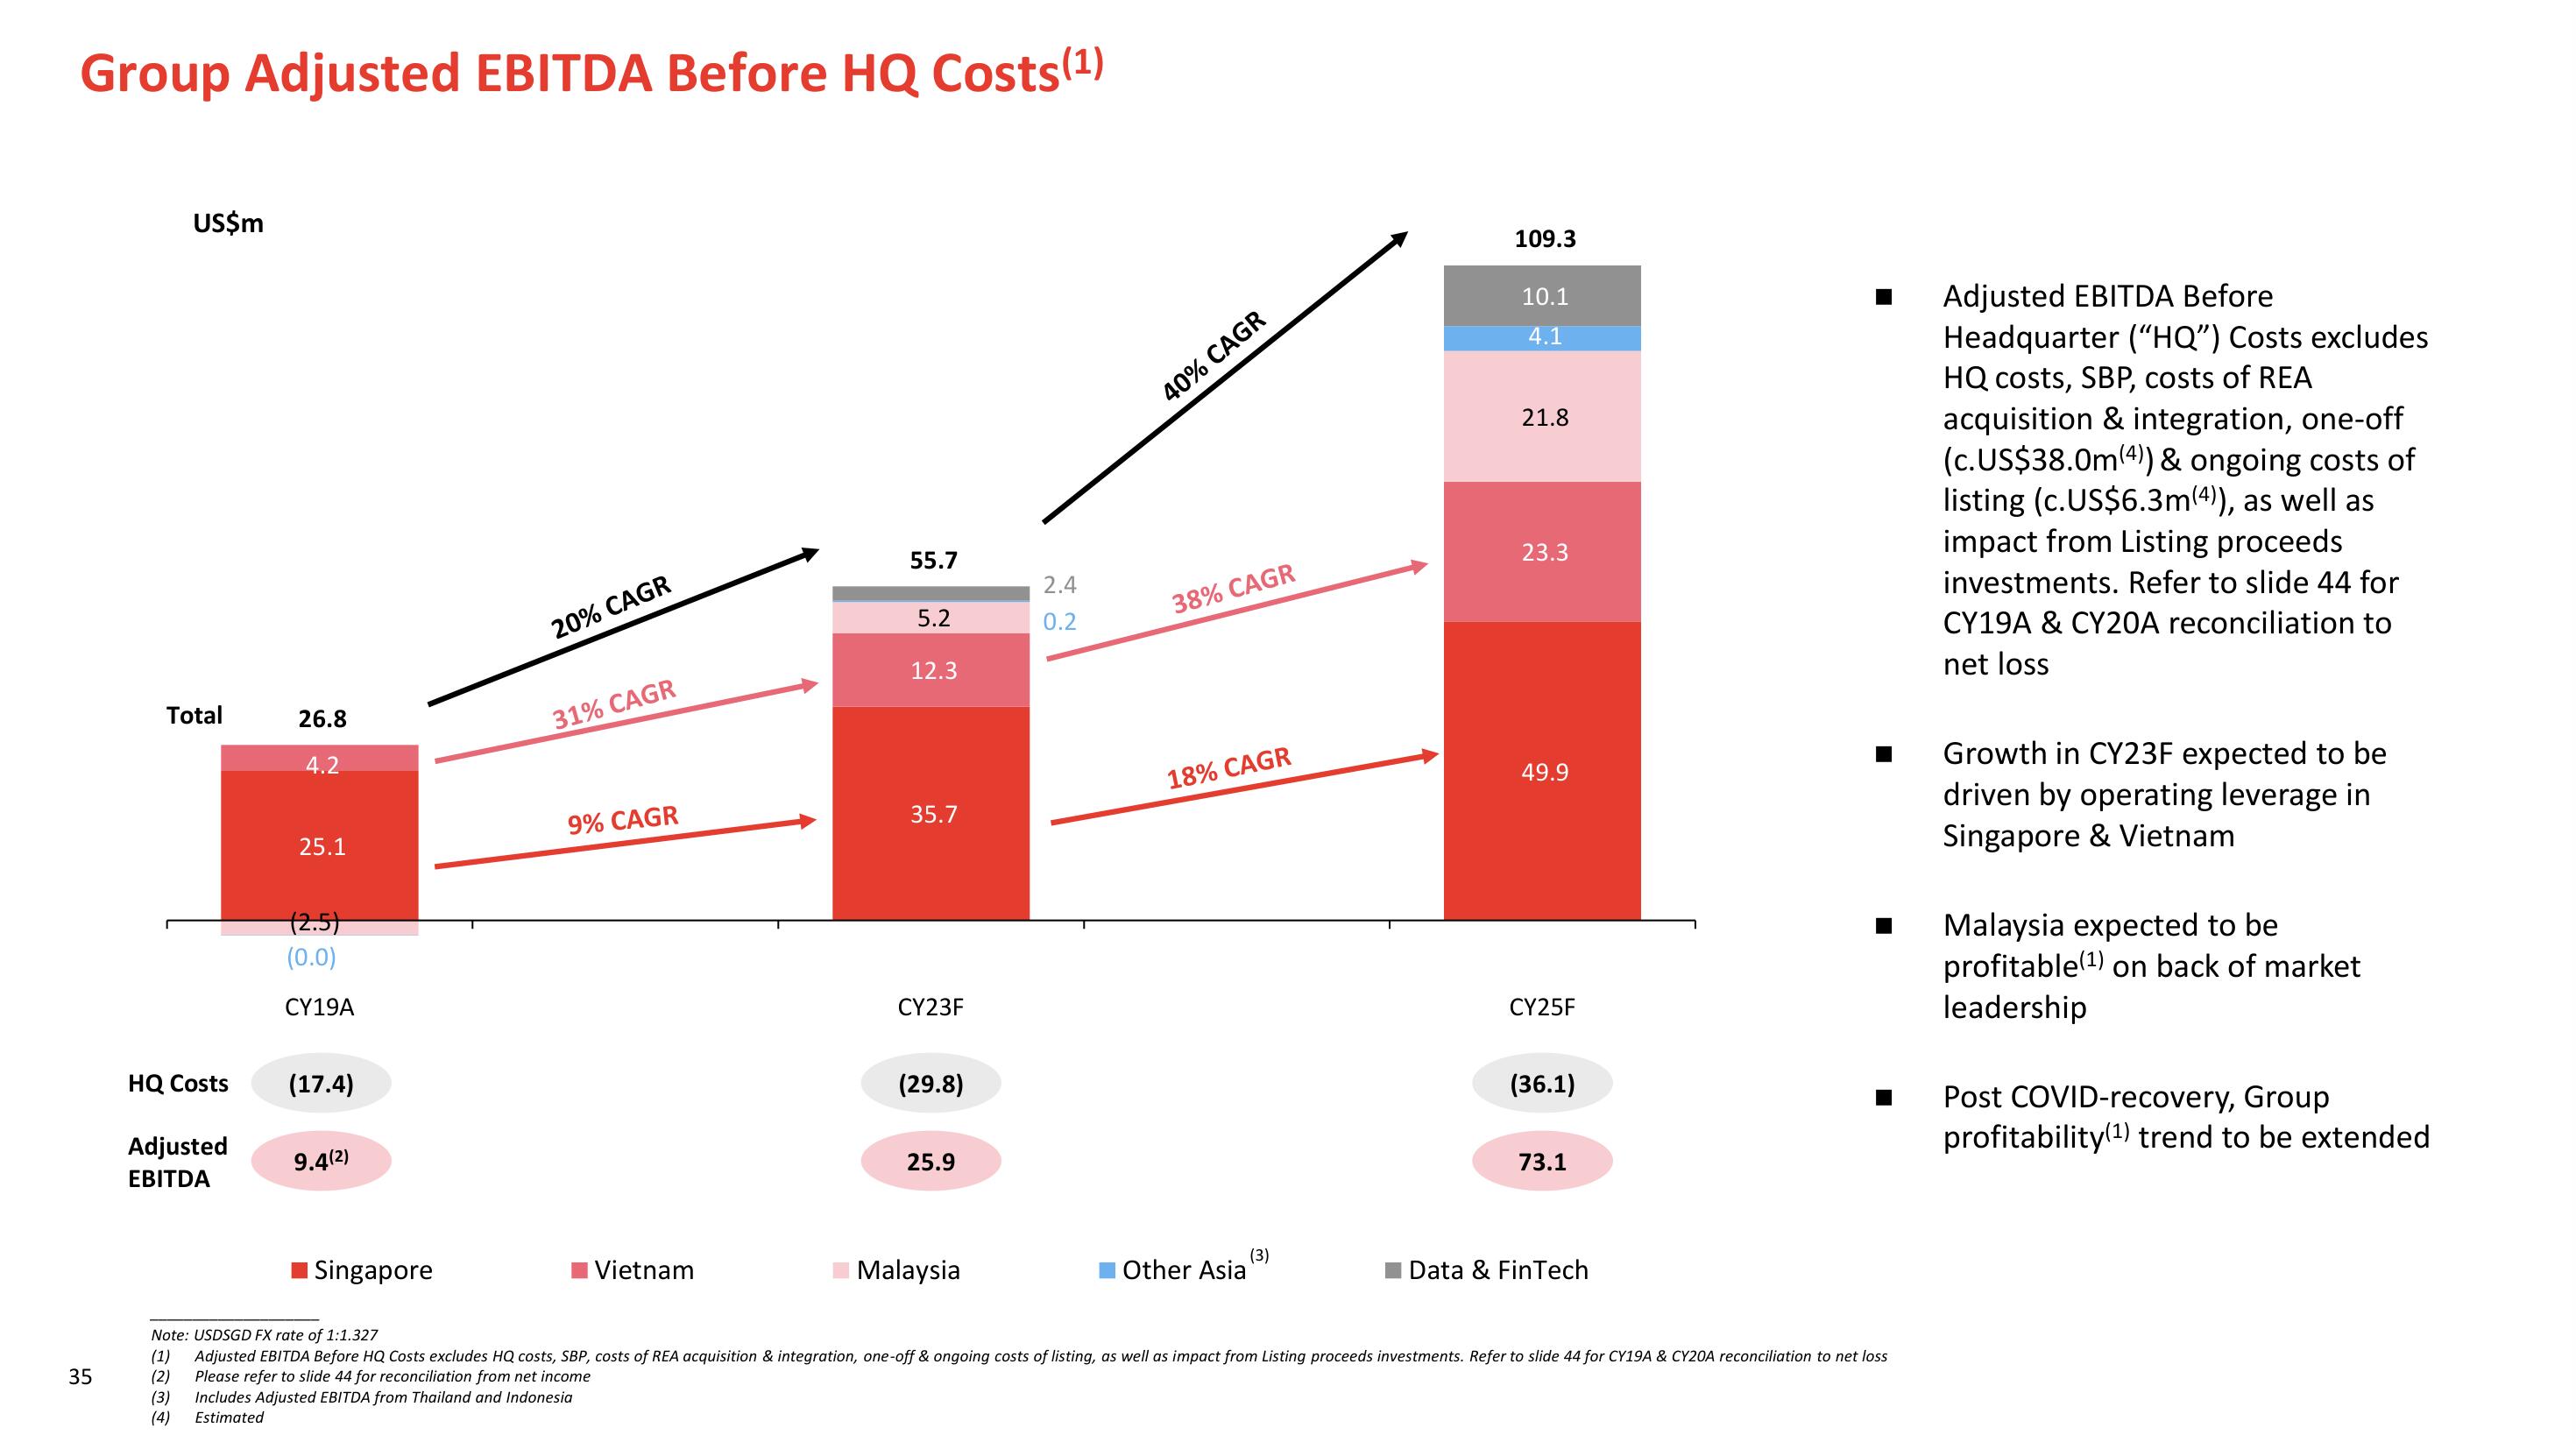
Adjusted EBITDA Before
Headquarter ("HQ") Costs excludes
HQ costs, SBP, costs of REA
acquisition & integration, one-off
(c.US$38.0m (4)) & ongoing costs of
listing (c.US$6.3m (4)), as well as
impact from Listing proceeds
investments. Refer to slide 44 for
CY19A & CY20A reconciliation to
net loss
Growth in CY23F expected to be
driven by operating leverage in
Singapore & Vietnam
Malaysia expected to be
profitable(¹) on back of market
leadership
Post COVID-recovery, Group
profitability(¹) trend to be extendedView entire presentation