Kering Investor Presentation Deck
- REVENUE
(in €m, and comparable growth in %)
681
H1 2020
●
+75%
% comp.
-
W. Europe
N. America
Japan
APAC
ROW
Total
Retail
+25%
Retail (73% of H1 sales)
Q2
+97%
+399%
+97%
+67%
+355%
+140%
Wholesale
+28%
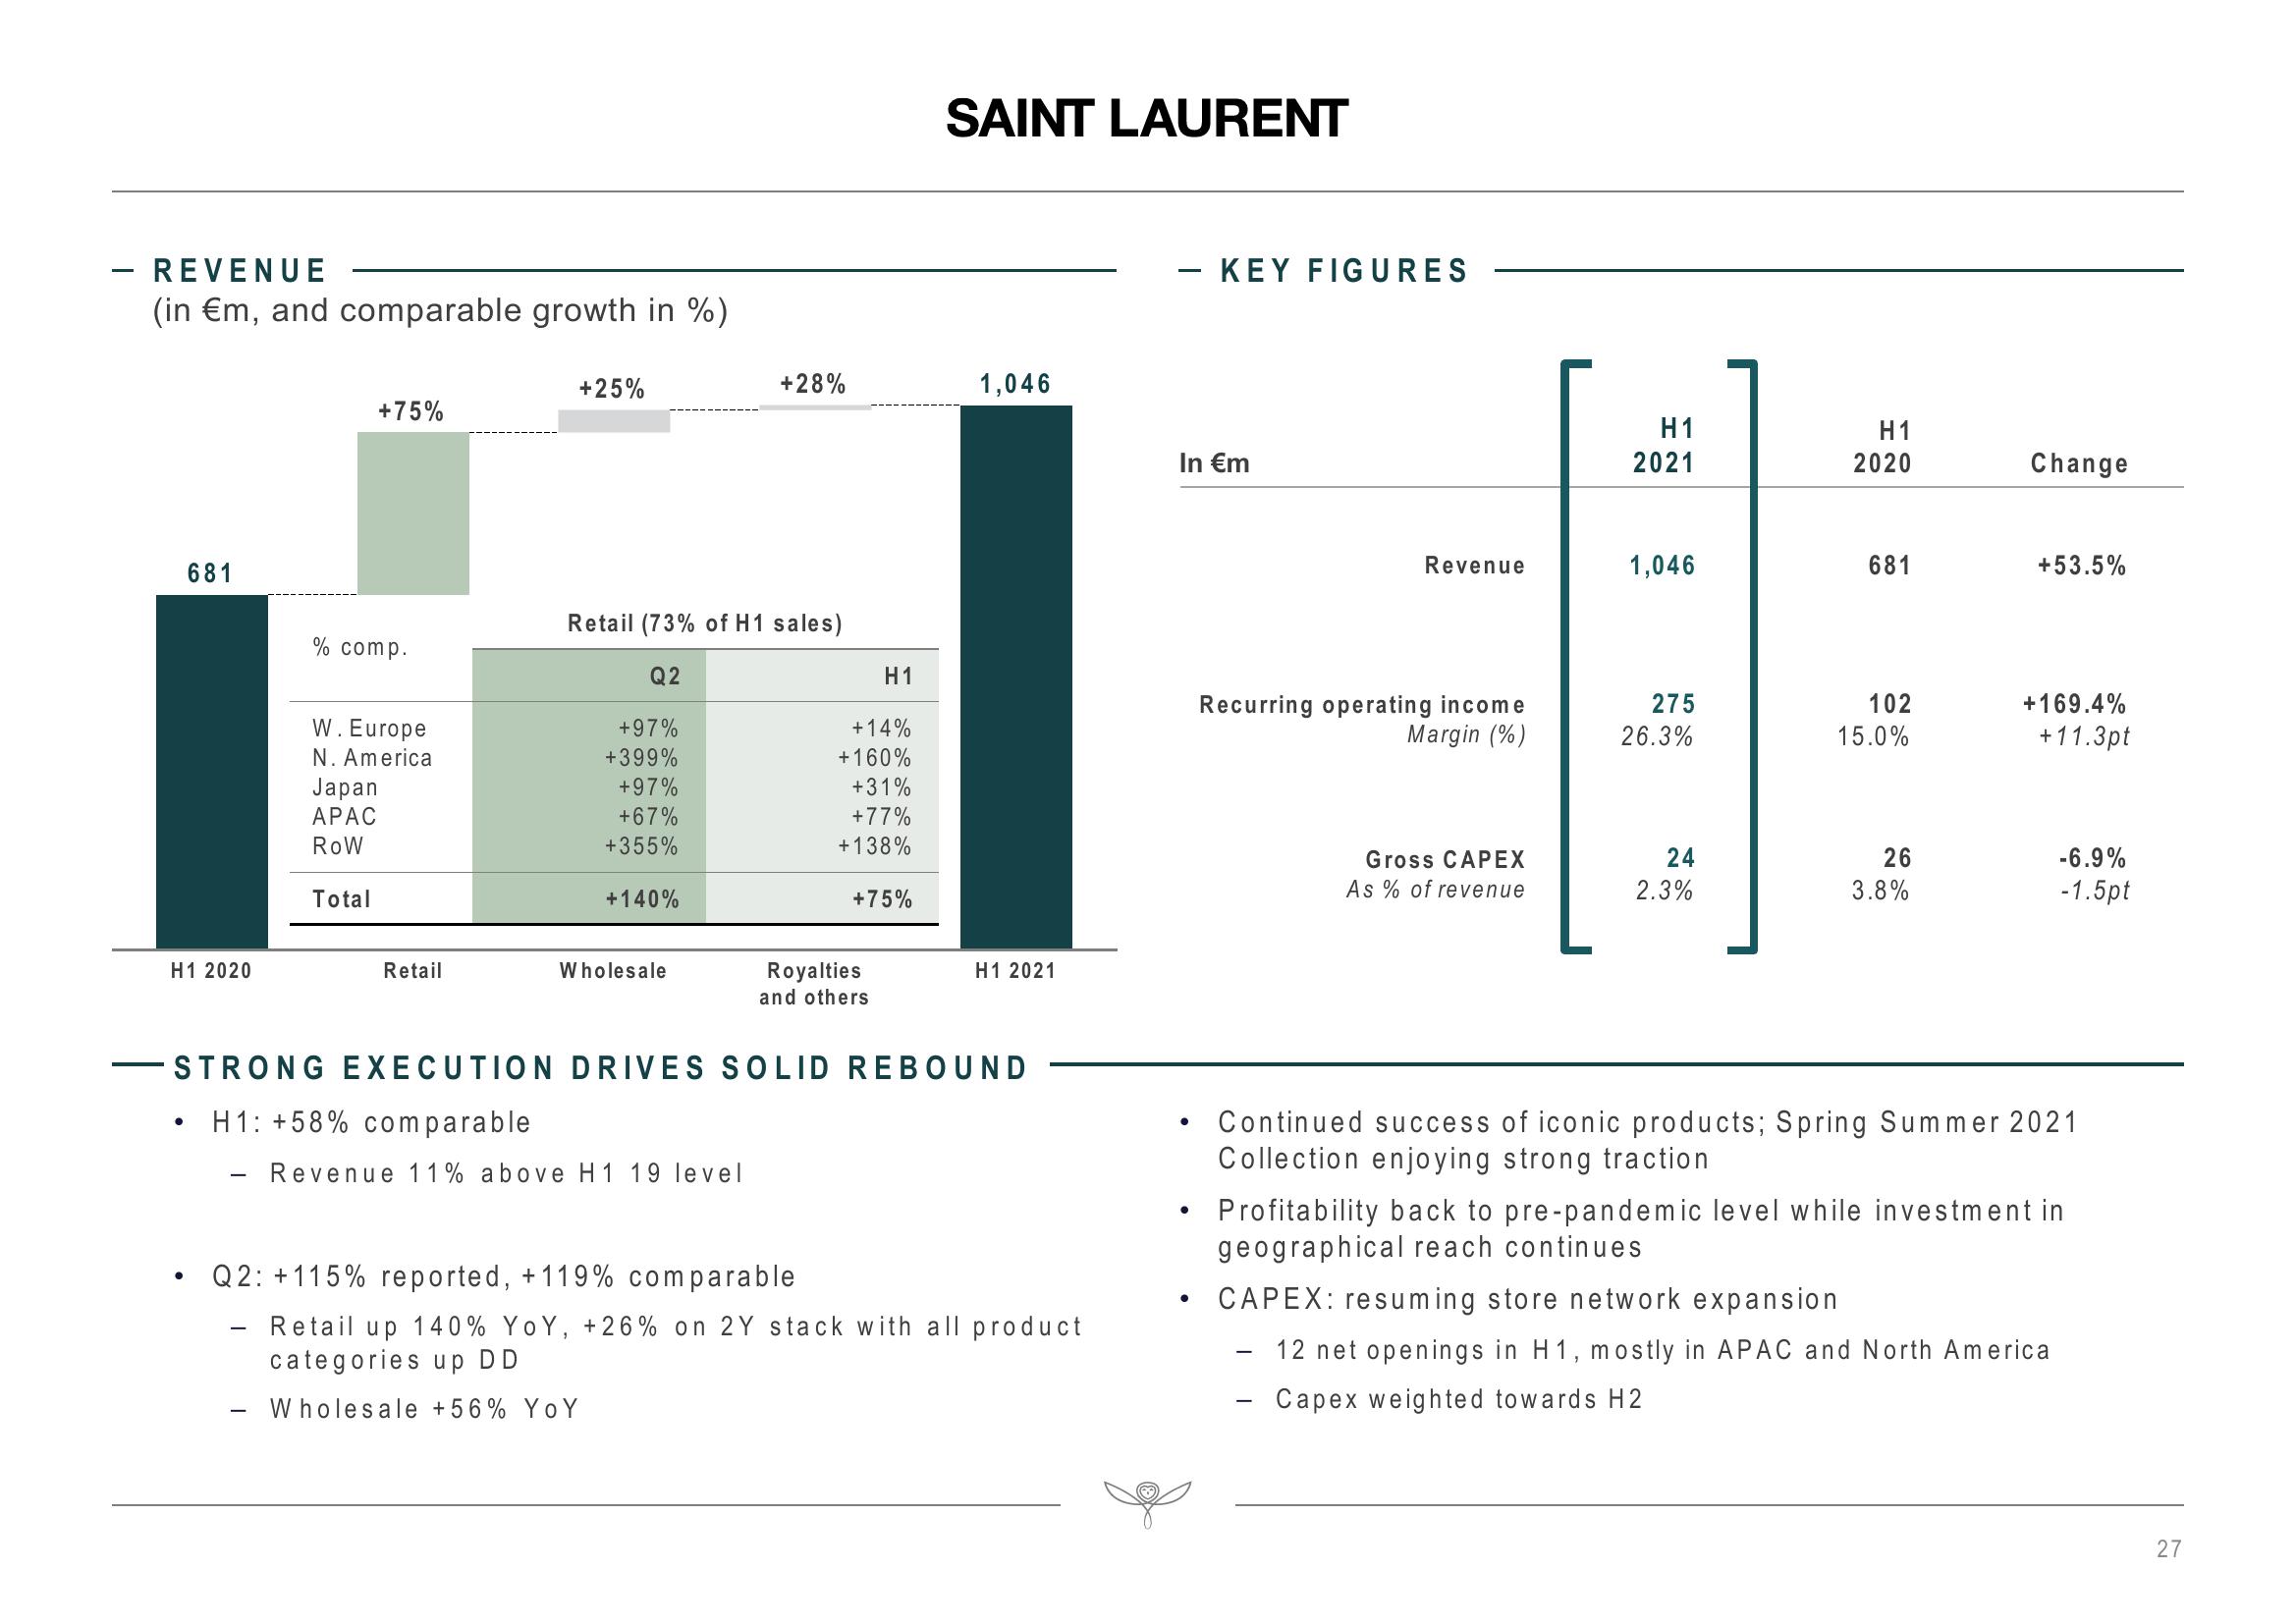
Revenue 11% above H 1 19 level
H1
+14%
+ 160%
+31%
+77%
+138%
+75%
Royalties
and others
SAINT LAURENT
STRONG EXECUTION DRIVES SOLID REBOUND
H1: +58% comparable
1,046
H1 2021
Q2: +115% reported, +119% comparable
Retail up 140% YoY, +26% on 2Y stack with all product
categories up DD
- Wholesale +56% YoY
- KEY FIGURES
In €m
●
●
●
Revenue
Recurring operating income
Margin (%)
Gross CAPEX
As % of revenue
H1
2021
1,046
275
26.3%
24
2.3%
H1
2020
681
102
15.0%
26
3.8%
Change
+53.5%
+169.4%
+11.3pt
-6.9%
-1.5pt
Continued success of iconic products; Spring Summer 2021
Collection enjoying strong traction
Profitability back to pre-pandemic level while investment in
geographical reach continues
CAPEX: resuming store network expansion
12 net openings in H1, mostly in APAC and North America
- Capex weighted towards H2
27View entire presentation