Bakkt Results Presentation Deck
FINANCIAL RESULTS
Summary of 4Q22 condensed results
●
●
●
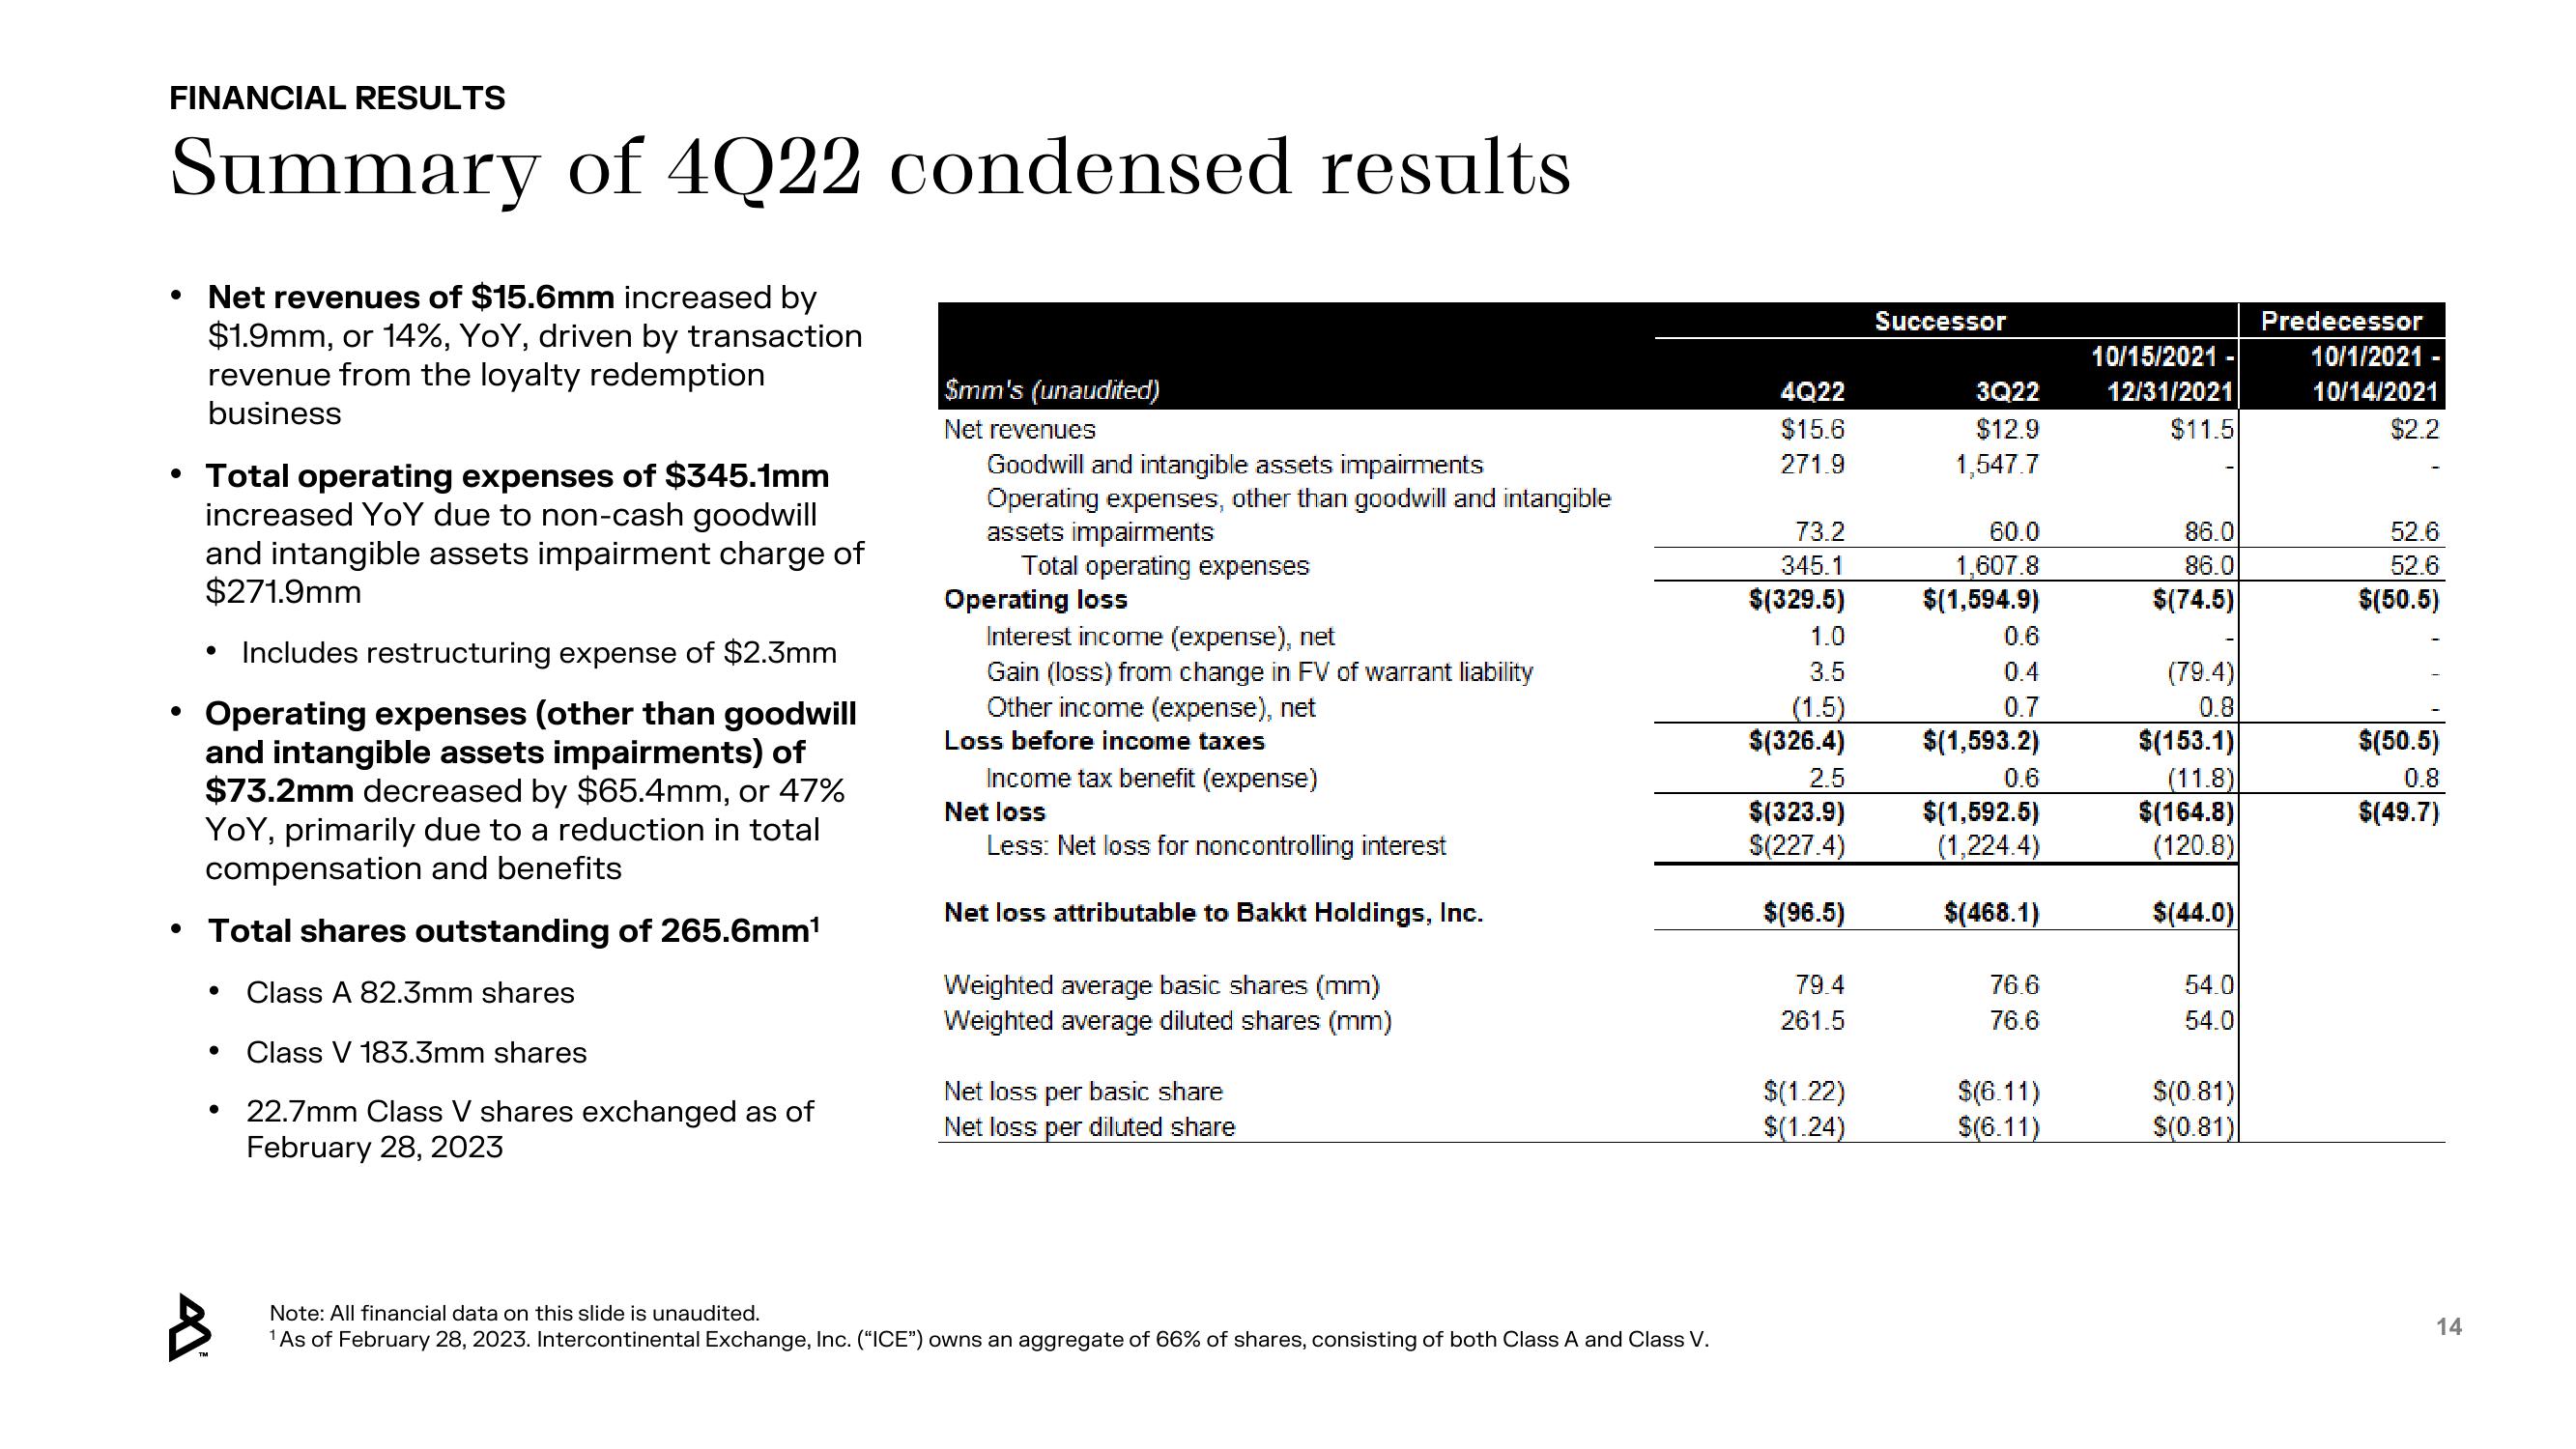
Net revenues of $15.6mm increased by
$1.9mm, or 14%, YoY, driven by transaction
revenue from the loyalty redemption
business
Total operating expenses of $345.1mm
increased YoY due to non-cash goodwill
and intangible assets impairment charge of
$271.9mm
Includes restructuring expense of $2.3mm
Operating expenses (other than goodwill
and intangible assets impairments) of
$73.2mm decreased by $65.4mm, or 47%
YoY, primarily due to a reduction in total
compensation and benefits
●
• Total shares outstanding of 265.6mm¹
Class A 82.3mm shares
Class V 183.3mm shares
• 22.7mm Class V shares exchanged as of
February 28, 2023
●
$mm's (unaudited)
Net revenues
Goodwill and intangible assets impairments
Operating expenses, other than goodwill and intangible
assets impairments
Total operating expenses
Operating loss
Interest income (expense), net
Gain (loss) from change in FV of warrant liability
Other income (expense), net
Loss before income taxes
Income tax benefit (expense)
Net loss
Less: Net loss for noncontrolling interest
Net loss attributable to Bakkt Holdings, Inc.
Weighted average basic shares (mm)
Weighted average diluted shares (mm)
Net loss per basic share
Net loss per diluted share
Note: All financial data on this slide is unaudited.
¹ As of February 28, 2023. Intercontinental Exchange, Inc. ("ICE") owns an aggregate of 66% of shares, consisting of both Class A and Class V.
4Q22
$15.6
271.9
73.2
345.1
$(329.5)
1.0
3.5
(1.5)
$(326.4)
2.5
$(323.9)
$(227.4)
$(96.5)
79.4
261.5
$(1.22)
$(1.24)
Successor
3Q22
$12.9
1,547.7
60.0
1,607.8
$(1,594.9)
0.6
0.4
0.7
$(1,593.2)
0.6
$(1,592.5)
(1,224.4)
$(468.1)
76.6
76.6
$(6.11)
$(6.11)
10/15/2021
12/31/2021
$11.5
86.0
86.0
$(74.5)
(79.4)
0.8
$(153.1)
(11.8)
$(164.8)
(120.8)
$(44.0)
54.0
54.0
$(0.81)
$(0.81)
Predecessor
10/1/2021
10/14/2021
$2.2
52.6
52.6
$(50.5)
$(50.5)
0.8
$(49.7)
14View entire presentation