Shift SPAC Presentation Deck
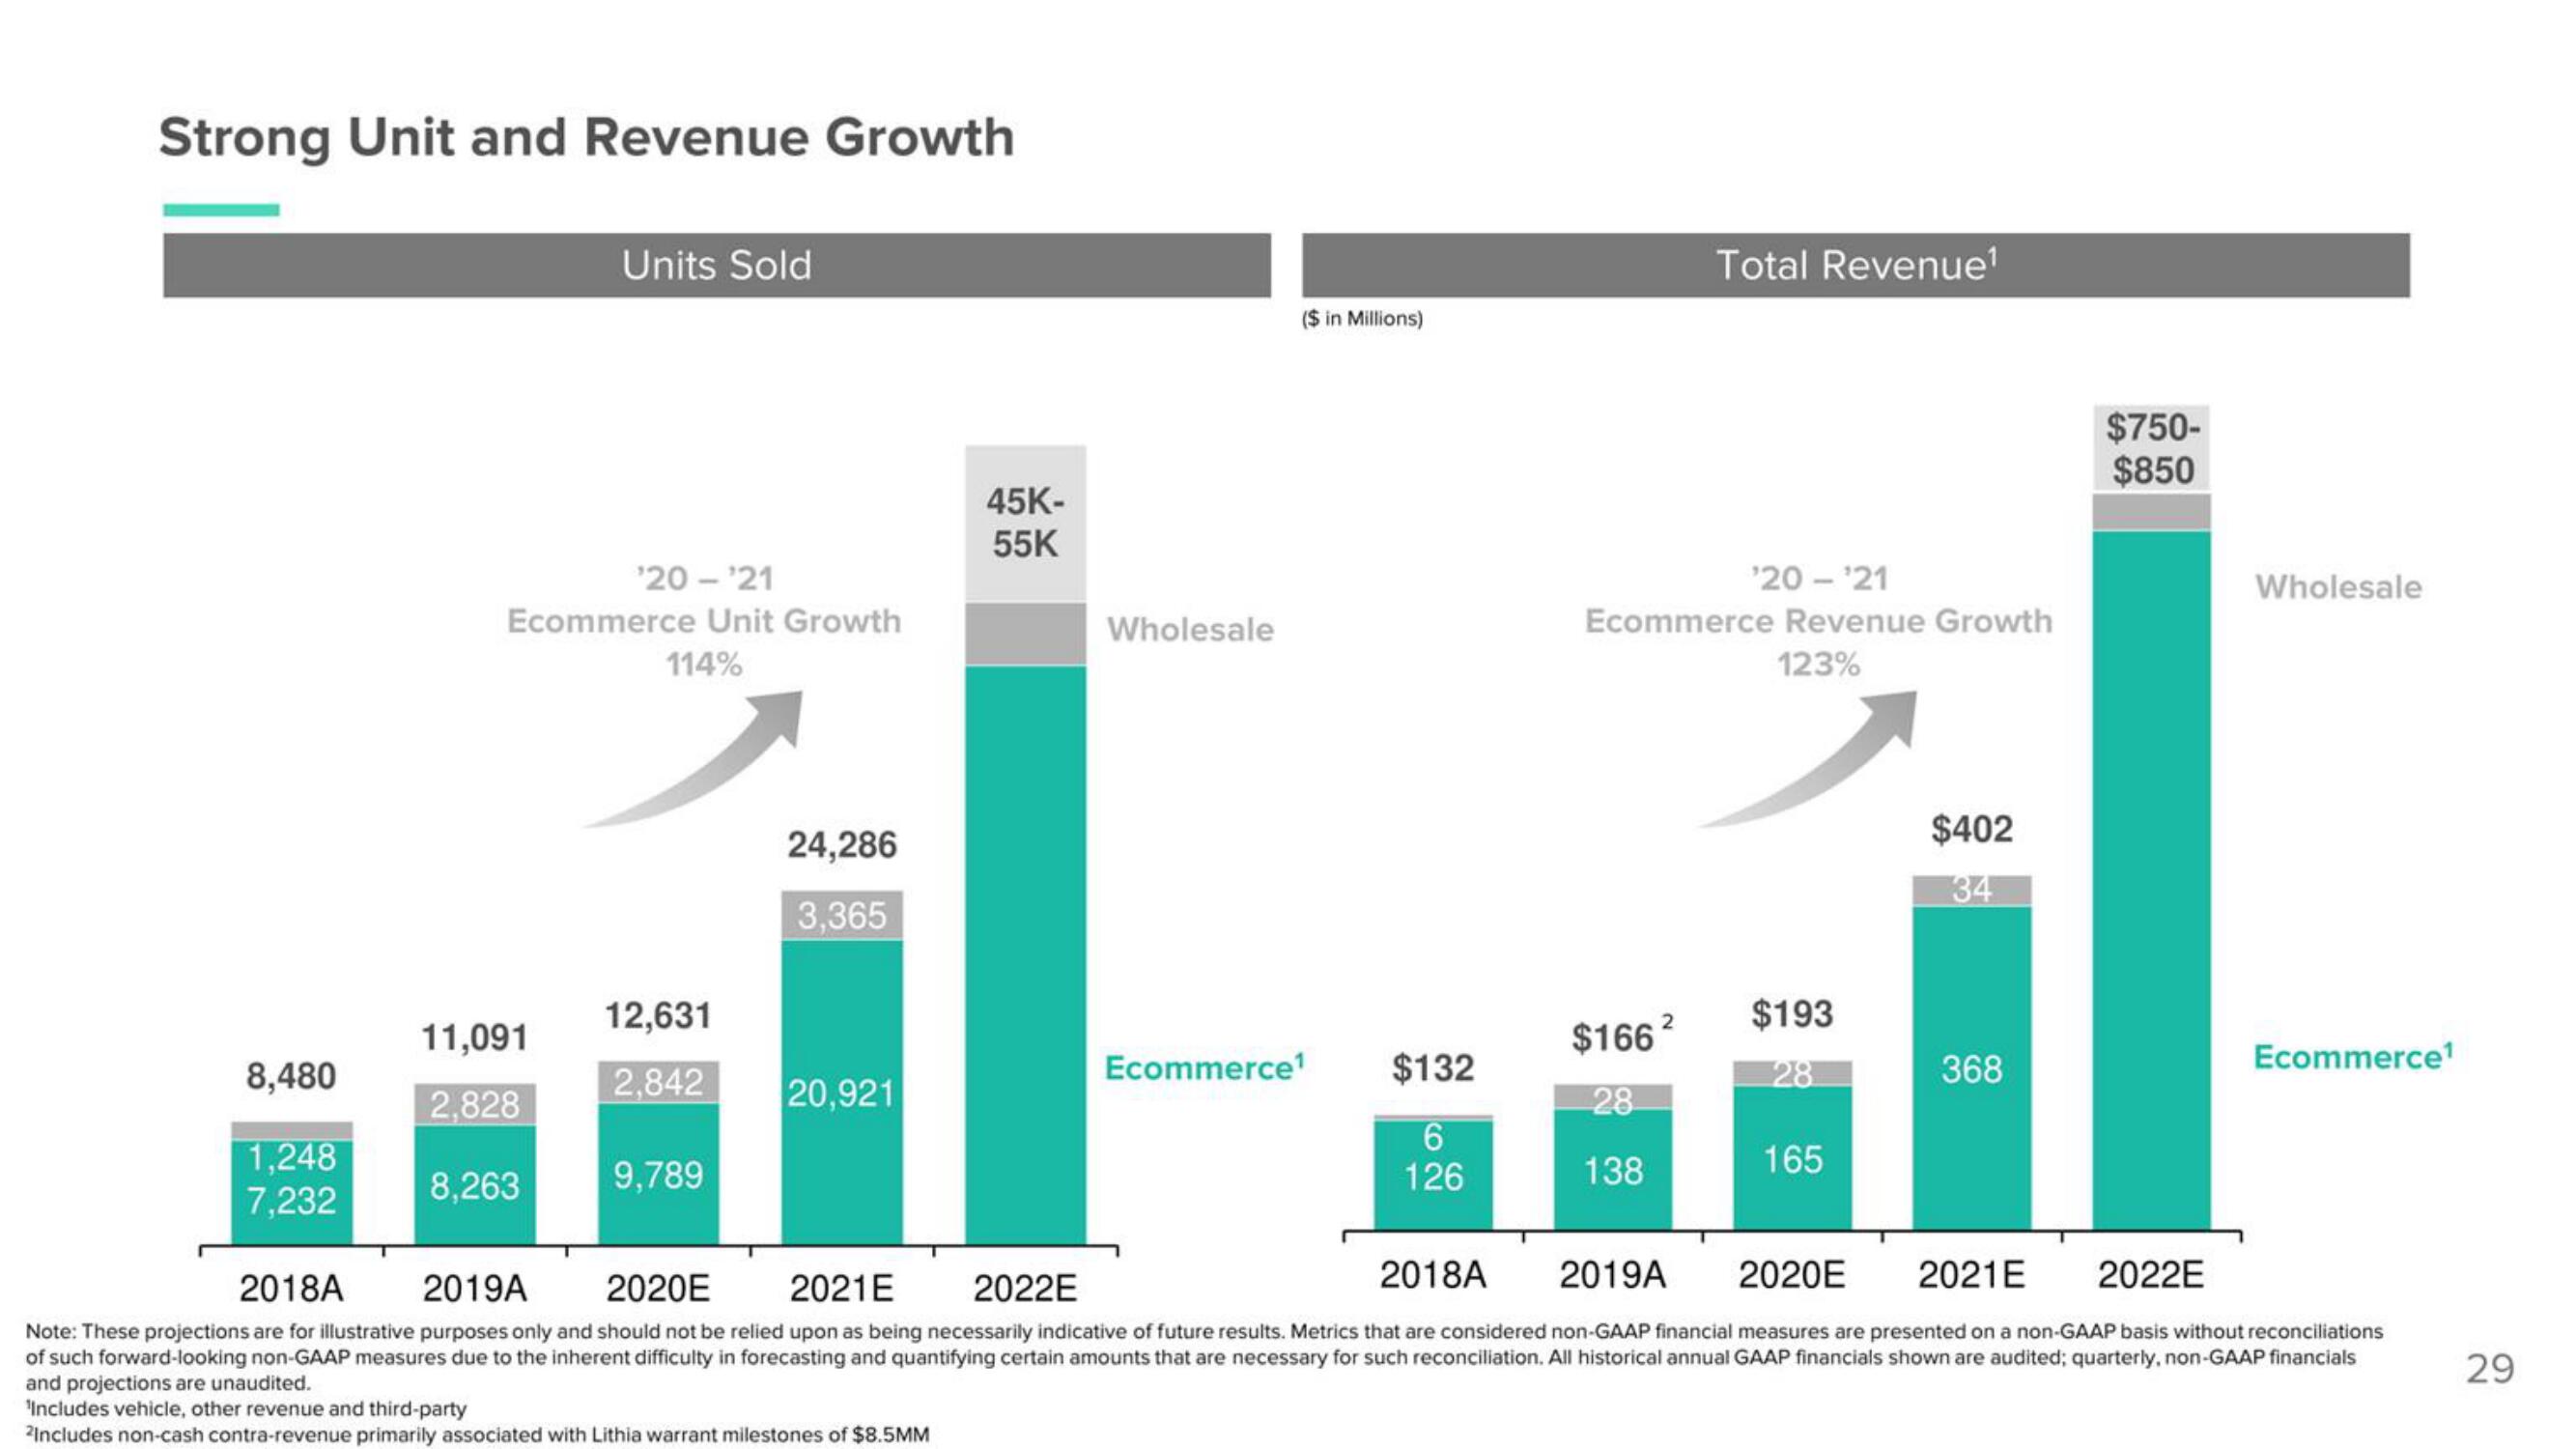
Strong Unit and Revenue Growth
8,480
1,248
7,232
Units Sold
¹20-¹21
Ecommerce Unit Growth
114%
11,091
2,828
8,263
12,631
2,842
9,789
24,286
3,365
20,921
45K-
55K
Wholesale
($ in Millions)
Ecommerce¹
$132
6
126
Total Revenue¹
¹20-¹21
Ecommerce Revenue Growth
123%
$166²
28
138
$193
28
165
$402
34
368
$750-
$850
Wholesale
Ecommerce¹
2022E
2021E
2018A
2019A
2021E
2020E
2022E
2019A 2020E
2018A
Note: These projections are for illustrative purposes only and should not be relied upon as being necessarily indicative of future results. Metrics that are considered non-GAAP financial measures are presented on a non-GAAP basis without reconciliations
of such forward-looking non-GAAP measures due to the inherent difficulty in forecasting and quantifying certain amounts that are necessary for such reconciliation. All historical annual GAAP financials shown are audited; quarterly, non-GAAP financials
and projections are unaudited.
¹Includes vehicle, other revenue and third-party
²Includes non-cash contra-revenue primarily associated with Lithia warrant milestones of $8.5MM
29View entire presentation