Credit Suisse Investment Banking Pitch Book
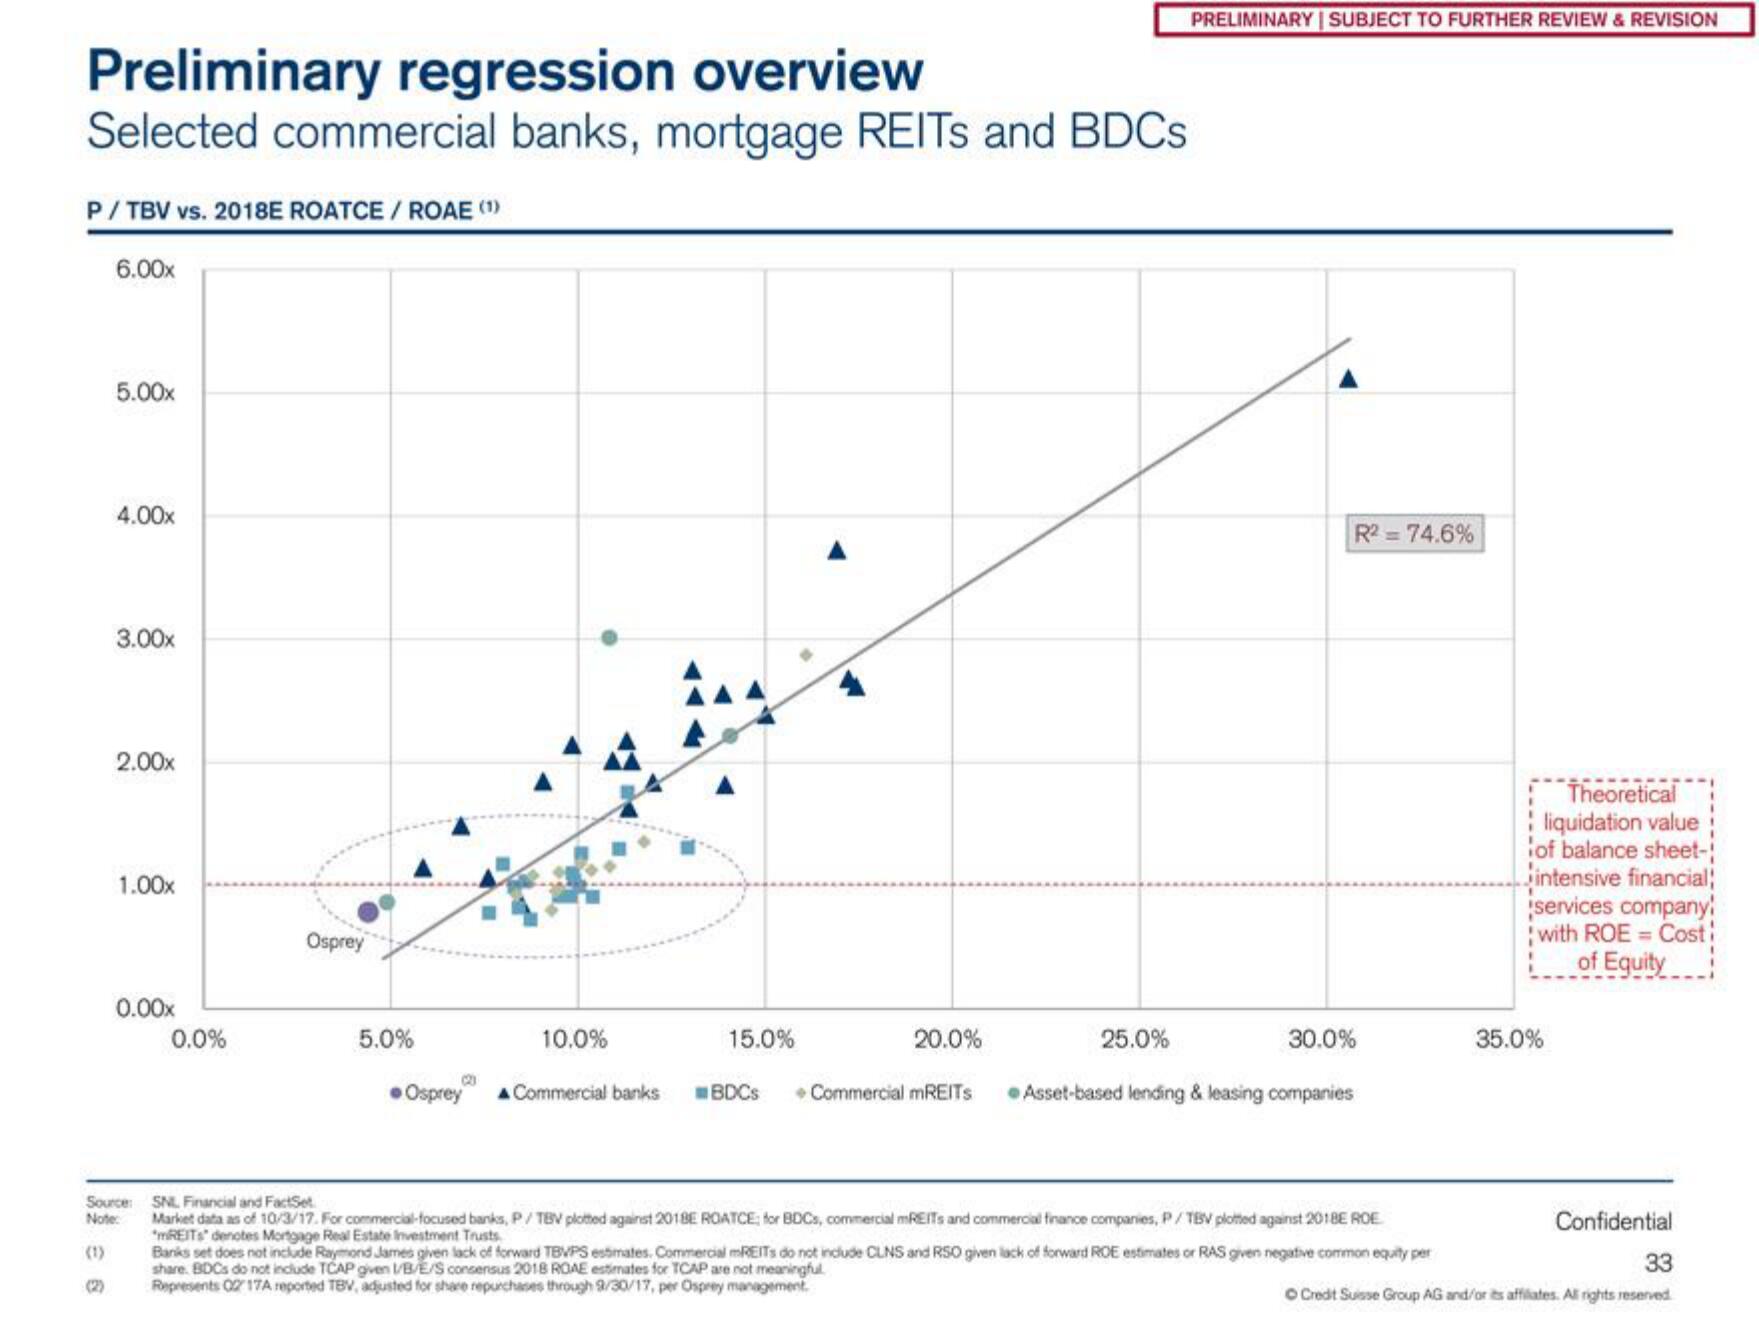
Preliminary regression overview
Selected commercial banks, mortgage REITS and BDCs
P/TBV vs. 2018E ROATCE / ROAE (1)
6.00x
(1)
5.00x
4.00x
3.00x
2.00x
1.00x
0.00x
Source:
Note:
0.0%
Osprey
5.0%
(23
10.0%
Osprey A Commercial banks
15.0%
BDCS
20.0%
Commercial mREITS
25.0%
PRELIMINARY | SUBJECT TO FURTHER REVIEW & REVISION
R²=74.6%
30.0%
Asset-based lending & leasing companies
SNL Financial and FactSet
Market data as of 10/3/17. For commercial-focused banks, P/TBV plotted against 2018E ROATCE: for BDCs, commercial mREITs and commercial finance companies, P/TBV plotted against 2018E ROE
"REITS" denotes Mortgage Real Estate Investment Trusts
Banks set does not include Raymond James given lack of forward TBVPS estimates. Commercial mREITs do not include CLNS and RSO given lack of forward ROE estimates or RAS given negative common equity per
share. BDCs do not include TCAP given I/B/E/S consensus 2018 ROAE estimates for TCAP are not meaningful
Represents 0217A reported TBV, adjusted for share repurchases through 9/30/17, per Osprey management.
Theoretical
liquidation value
of balance sheet-
intensive financial
services company!
with ROE = Cost:
of Equity
35.0%
Confidential
33
Ⓒ Credit Suisse Group AG and/or its affiliates. All rights reserved.View entire presentation