Olaplex Investor Presentation Deck
OLAPLEX AT A GLANCE
Loyal Community
98%
of stylists agree that
OLAPLEX is innovative²
#1
follower count on Instagram
vs. similar brands
2x
higher NPS score than
similar brands
Financial Profile
$704.3M
FY 2022 Net sales 5
Beloved Brand
#1
bond-building haircare
brand in professional
#1
brand on Amazon
in haircare4
#1
haircare brand in 2022
at Sephora
68%
3-year Net sales growth CAGR
¹12 month period ended December 31, 2022.
2 OLAPLEX Pro Salon Survey, n=299
3 Product count excludes kits and alternate sizes.
Exceptional Profile
15
Products³
100+
Countries
worldwide
170+
Employees
60.9%
FY 2022 Adj. EBITDA margin
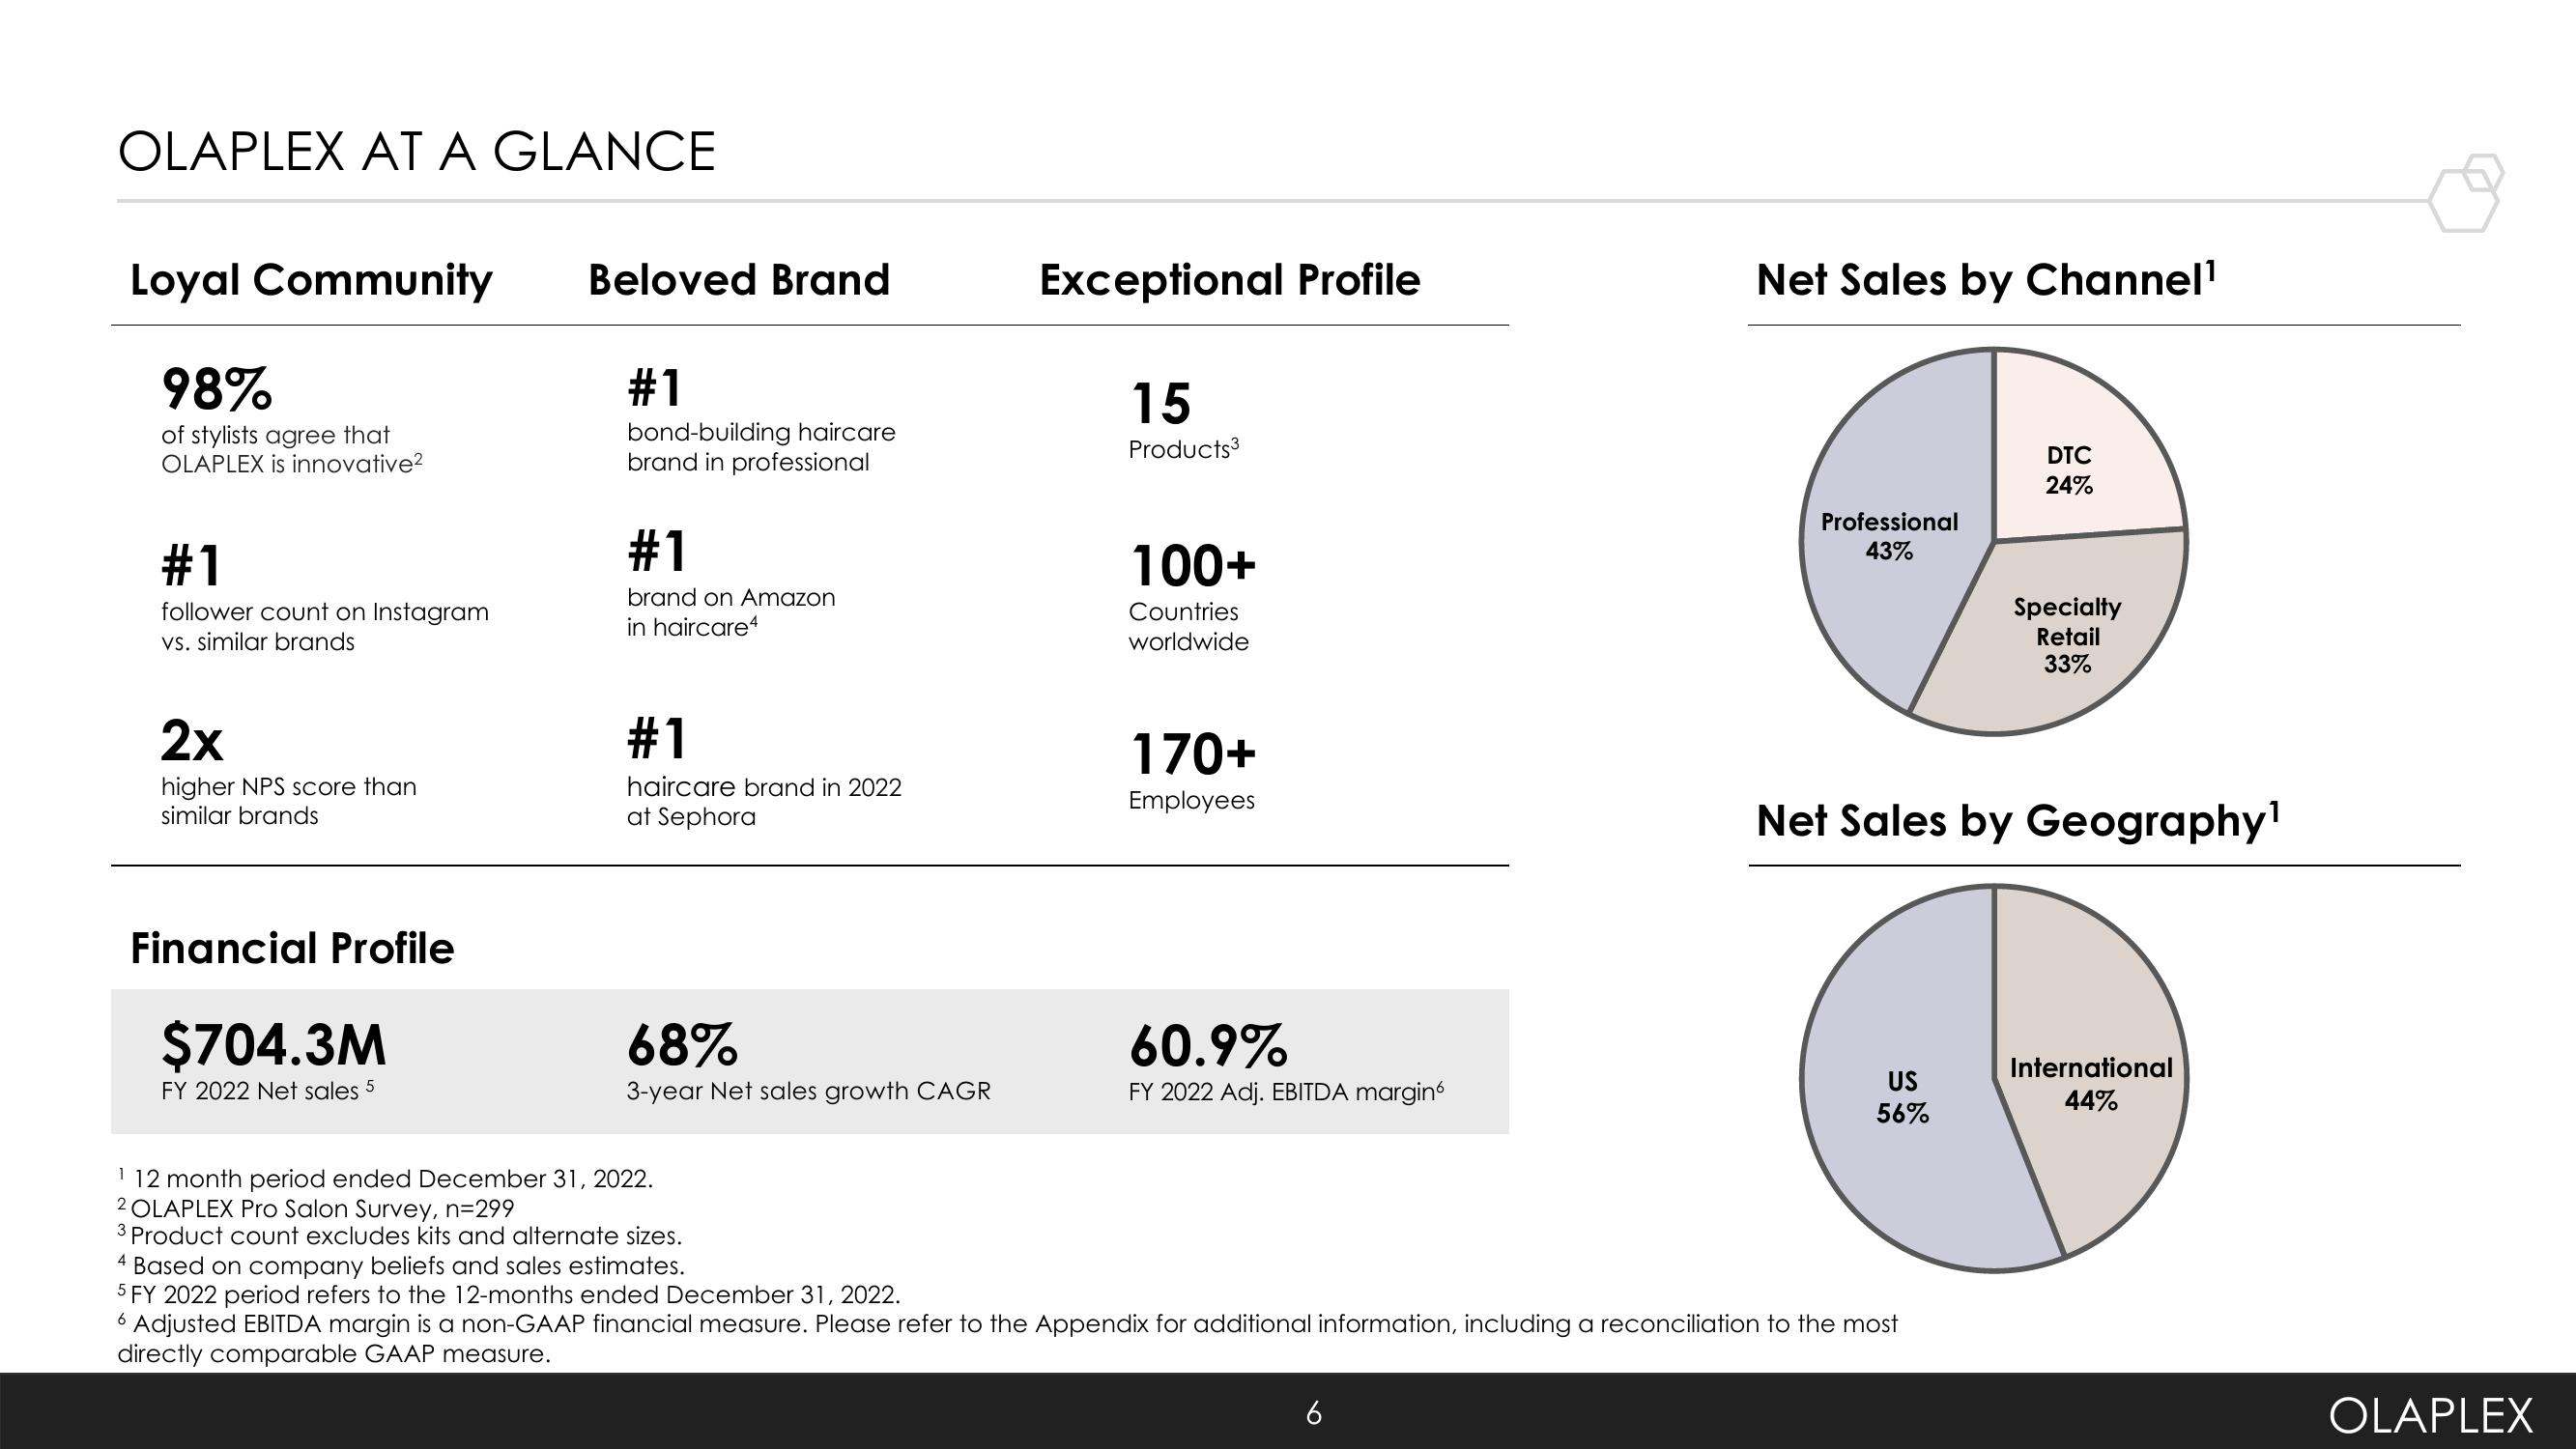
Net Sales by Channel¹
Professional
43%
US
56%
DTC
24%
Net Sales by Geography¹
4 Based on company beliefs and sales estimates.
5 FY 2022 period refers to the 12-months ended December 31, 2022.
6 Adjusted EBITDA margin is a non-GAAP financial measure. Please refer to the Appendix for additional information, including a reconciliation to the most
directly comparable GAAP measure.
Specialty
Retail
33%
International
44%
OLAPLEXView entire presentation