Stem SPAC Presentation Deck
stem Bookings, Deliveries, and Revenues
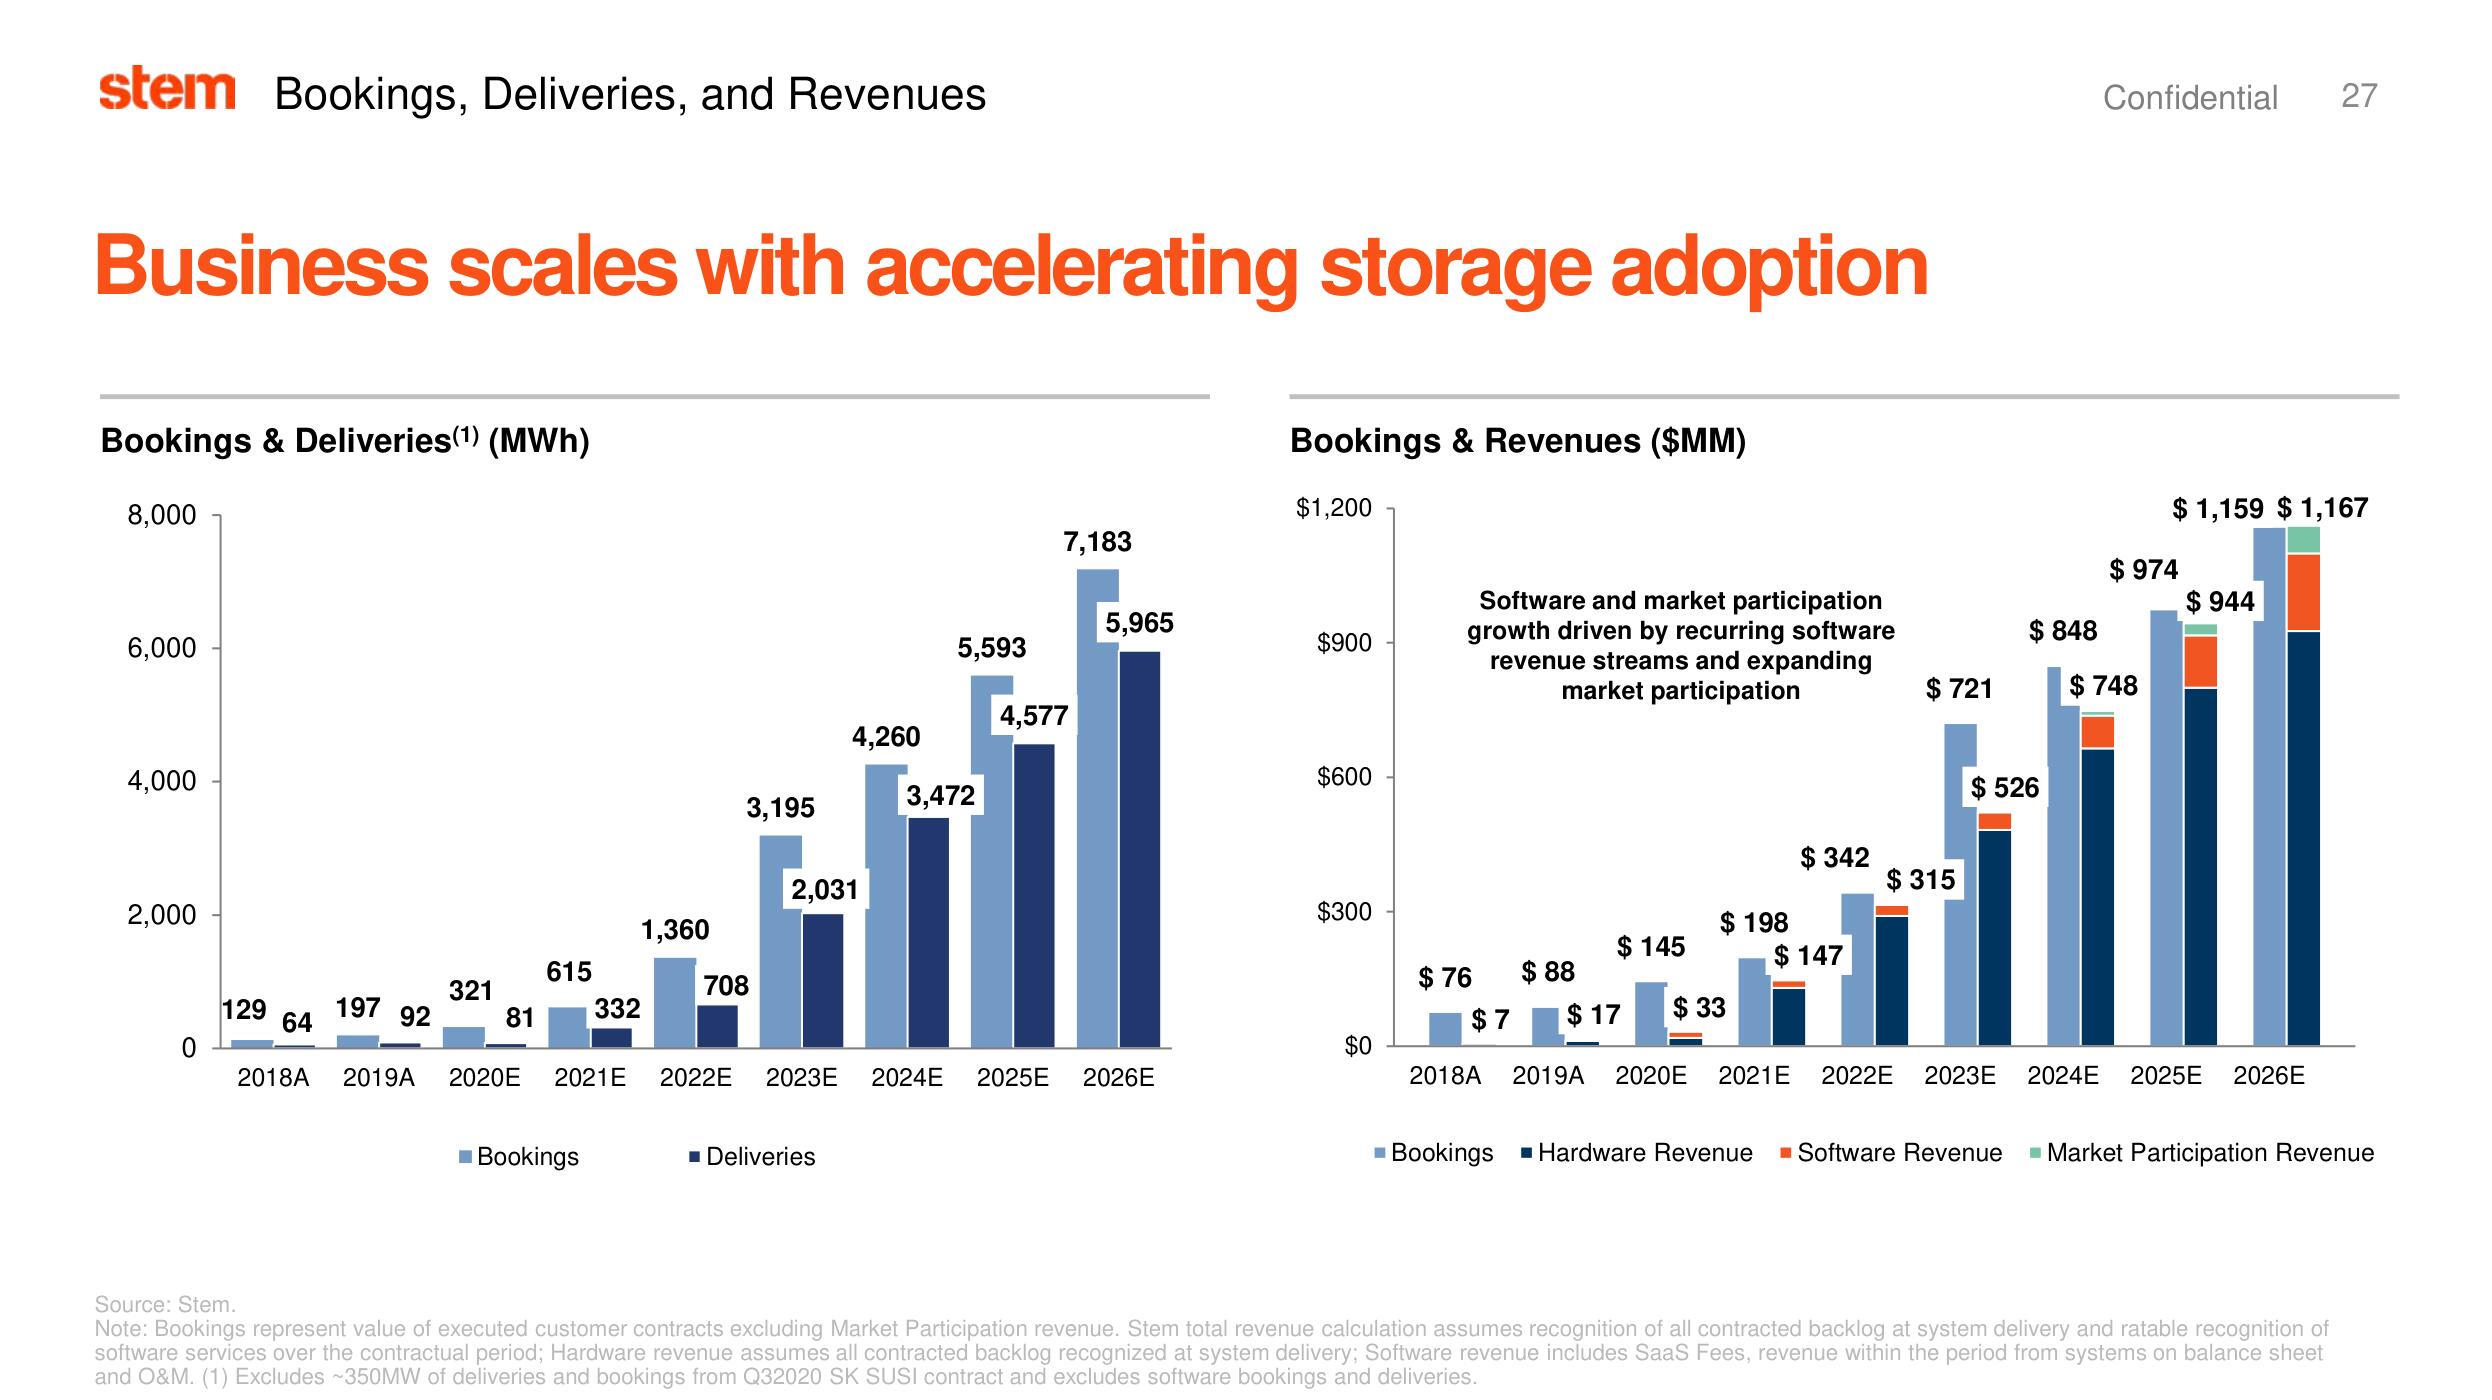
Business scales with accelerating storage adoption
Bookings & Deliveries (¹) (MWh)
8,000
6,000
4,000
2,000
0
129
64
197
92
321
81
615
2018A 2019A 2020E 2021 E
Bookings
1,360
332
3,195
708
4,260
2,031
■ Deliveries
5,593
3,472
7,183
4,577
5,965
2022E 2023E 2024E 2025E 2026E
Bookings & Revenues ($MM)
$1,200
$900
$600
$300
$0
Software and market participation
growth driven by recurring software
revenue streams and expanding
market participation
$76 $88
$145
$7 $17
$ 198
$33
$ 342
■ Bookings ■ Hardware Revenue
$147
$ 721
$315
$ 848
$ 526
Confidential 27
$1,159 $1,167
$974
$ 748
$944
2018A 2019A 2020E 2021E 2022E 2023E 2024E 2025E 2026E
Software Revenue ■ Market Participation Revenue
Source: Stem.
Note: Bookings represent value of executed customer contracts excluding Market Participation revenue. Stem total revenue calculation assumes recognition of all contracted backlog at system delivery and ratable recognition of
software services over the contractual period; Hardware revenue assumes all contracted backlog recognized at system delivery; Software revenue includes SaaS Fees, revenue within the period from systems on balance sheet
and O&M. (1) Excludes ~350MW of deliveries and bookings from Q32020 SK SUSI contract and excludes software bookings and deliveries.View entire presentation