Goldman Sachs Results Presentation Deck
Global Banking & Markets
$ in millions
Investment banking fees $
FICC
Equities
Other
Net revenues
Provision for credit losses
Operating expenses
Pre-tax earnings $
Net earnings $
Net earnings to common
Financial Results
Return on average common equity
2Q23
1,431
2,711
2,966
81
7,189
56
4,282
2,851
2,091
1,982
Average common equity $ 71,205
11.1%
VS.
1Q23
(9)%
(31)%
(2)%
N.M.
(15)%
(57)%
(7)%
(23)%
(30)%
(31)%
2%
(5.5)pp
VS.
2Q22
(20)% $
(26)%
1%
N.M.
(14)%
(73)%
(3)%
(23)% $
(32)% $
(33)% $
T
(5.5)pp
LA
2Q23
YTD
3,010
6,642
5,981
15,633
185
8,911
6,537
5,077
4,858
70,362
13.8%
VS.
2Q22
YTD
(24)%
(21)%
(3)%
N.M.
(15)%
(54)%
(5)%
(24)%
(30)%
(31)%
1%
(6.4)pp
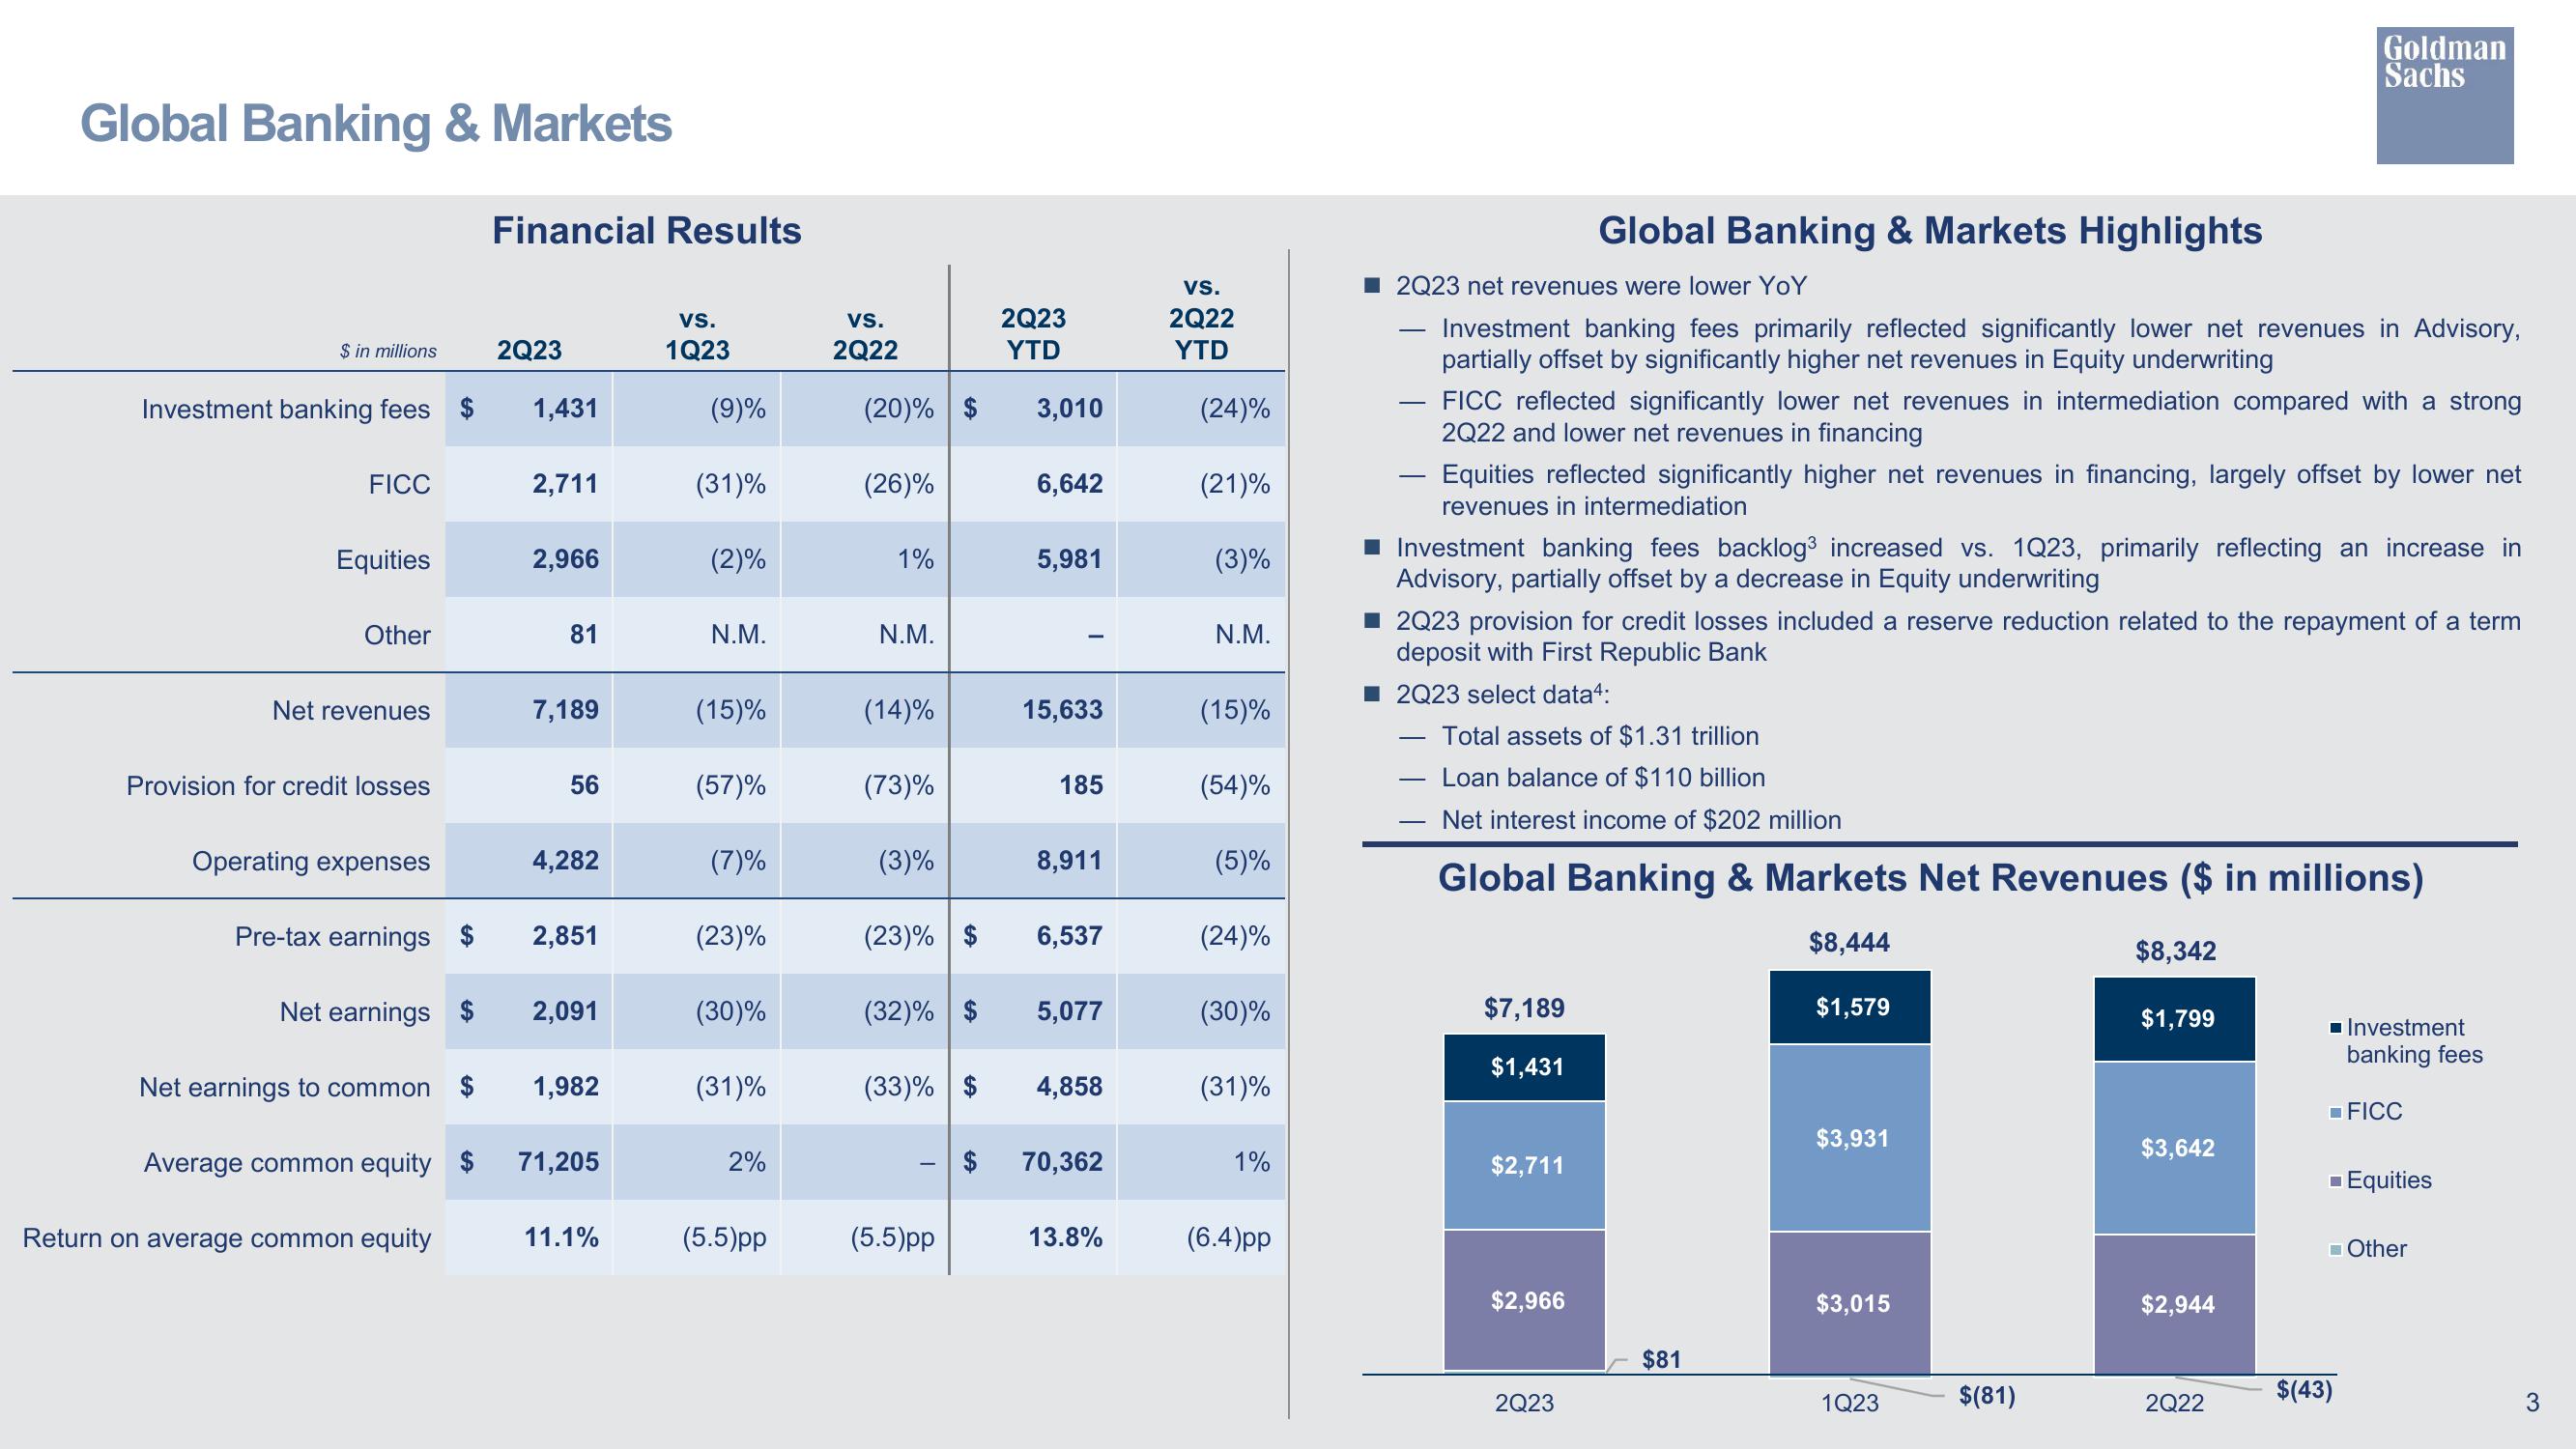
2Q23 net revenues were lower YoY
Investment banking fees primarily reflected significantly lower net revenues in Advisory,
partially offset by significantly higher net revenues in Equity underwriting
FICC reflected significantly lower net revenues in intermediation compared with a strong
2Q22 and lower net revenues in financing
Global Banking & Markets Highlights
Equities reflected significantly higher net revenues in financing, largely offset by lower net
revenues in intermediation
■ Investment banking fees backlog³ increased vs. 1Q23, primarily reflecting an increase in
Advisory, partially offset by a decrease in Equity underwriting
■ 2Q23 provision for credit losses included a reserve reduction related to the repayment of a term
deposit with First Republic Bank
■2Q23 select data4:
$7,189
$1,431
Total assets of $1.31 trillion
Loan balance of $110 billion
Net interest income of $202 million
Global Banking & Markets Net Revenues ($ in millions)
$8,444
$8,342
$1,799
$2,711
$2,966
2Q23
$81
$1,579
$3,931
$3,015
Goldman
Sachs
1Q23
$(81)
$3,642
$2,944
2Q22
■ Investment
$(43)
banking fees
FICC
■ Equities
Other
3View entire presentation