Hostess SPAC Presentation Deck
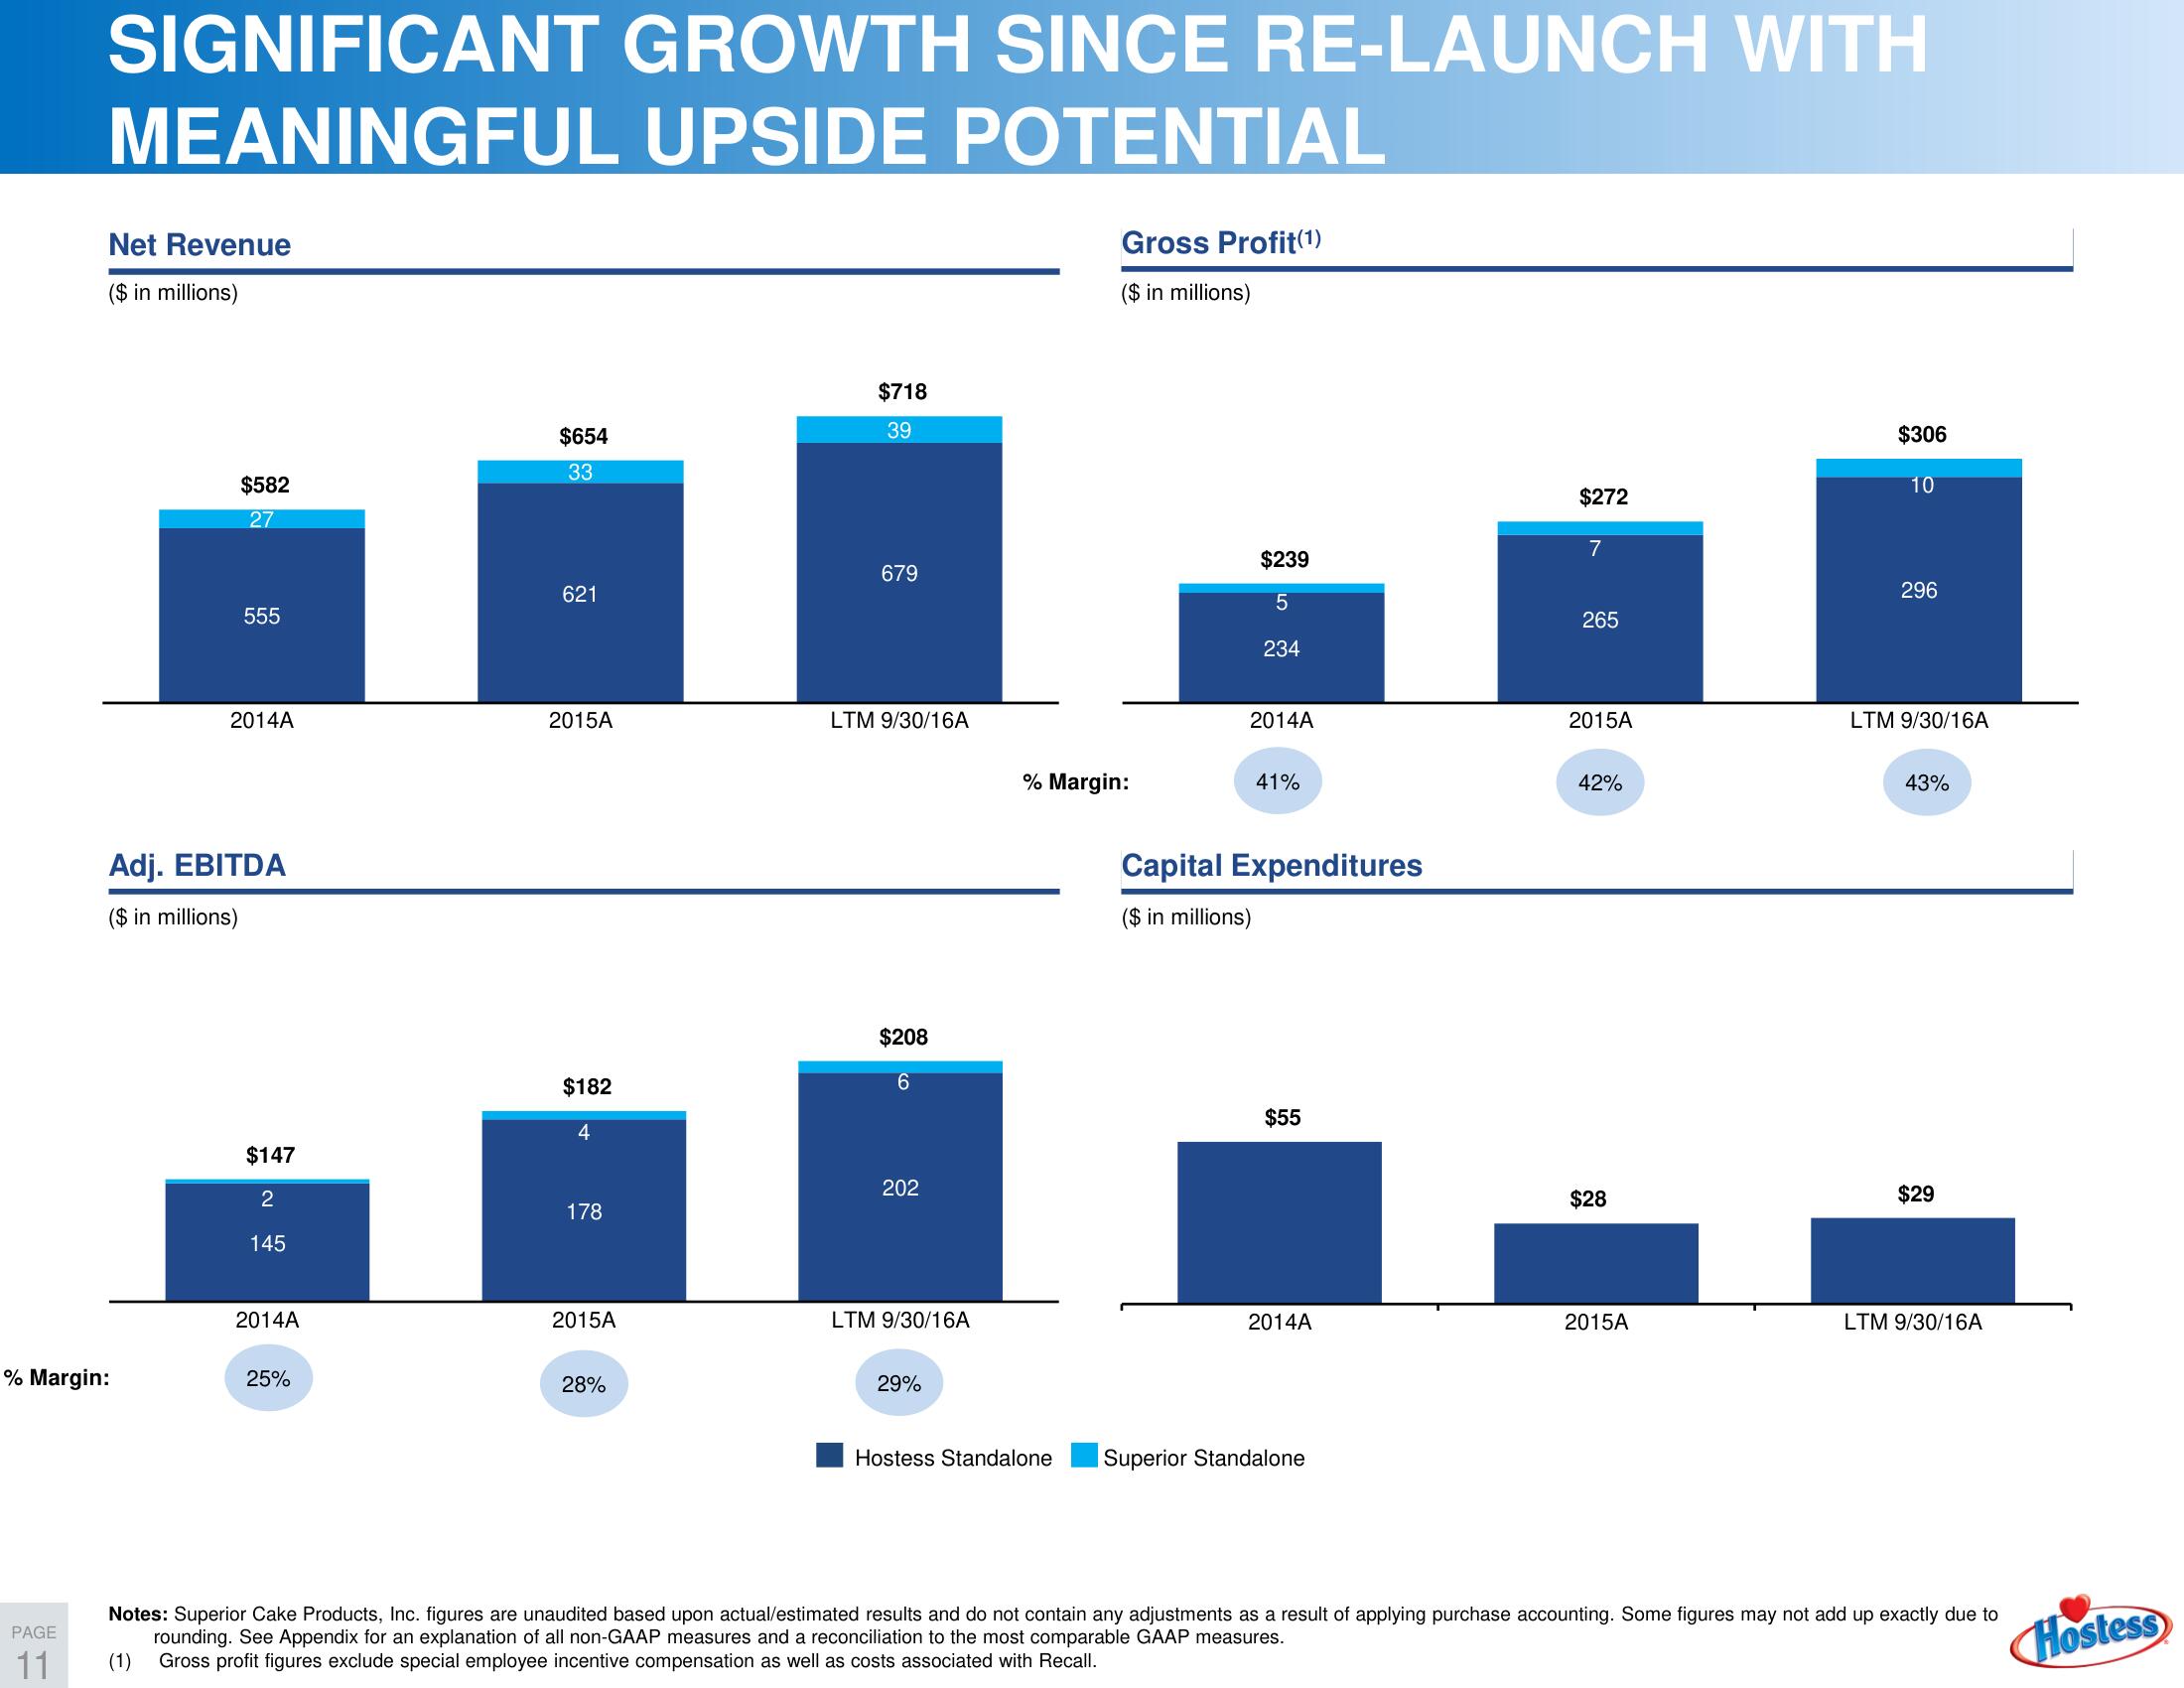
SIGNIFICANT GROWTH SINCE RE-LAUNCH WITH
MEANINGFUL UPSIDE POTENTIAL
PAGE
11
Net Revenue
($ in millions)
% Margin:
$582
27
555
2014A
Adj. EBITDA
($ in millions)
$147
2
145
2014A
25%
$654
33
621
2015A
$182
4
178
2015A
28%
$718
39
679
LTM 9/30/16A
$208
6
202
LTM 9/30/16A
29%
Gross Profit(1)
($ in millions)
% Margin:
Hostess Standalone
$239
5
234
2014A
41%
Capital Expenditures
($ in millions)
$55
2014A
Superior Standalone
$272
7
265
2015A
42%
$28
2015A
$306
10
296
LTM 9/30/16A
43%
$29
LTM 9/30/16A
Notes: Superior Cake Products, Inc. figures are unaudited based upon actual/estimated results and do not contain any adjustments as a result of applying purchase accounting. Some figures may not add up exactly due to
rounding. See Appendix for an explanation of all non-GAAP measures and a reconciliation to the most comparable GAAP measures.
(1) Gross profit figures exclude special employee incentive compensation as well as costs associated with Recall.
HostessView entire presentation