Paysafe Results Presentation Deck
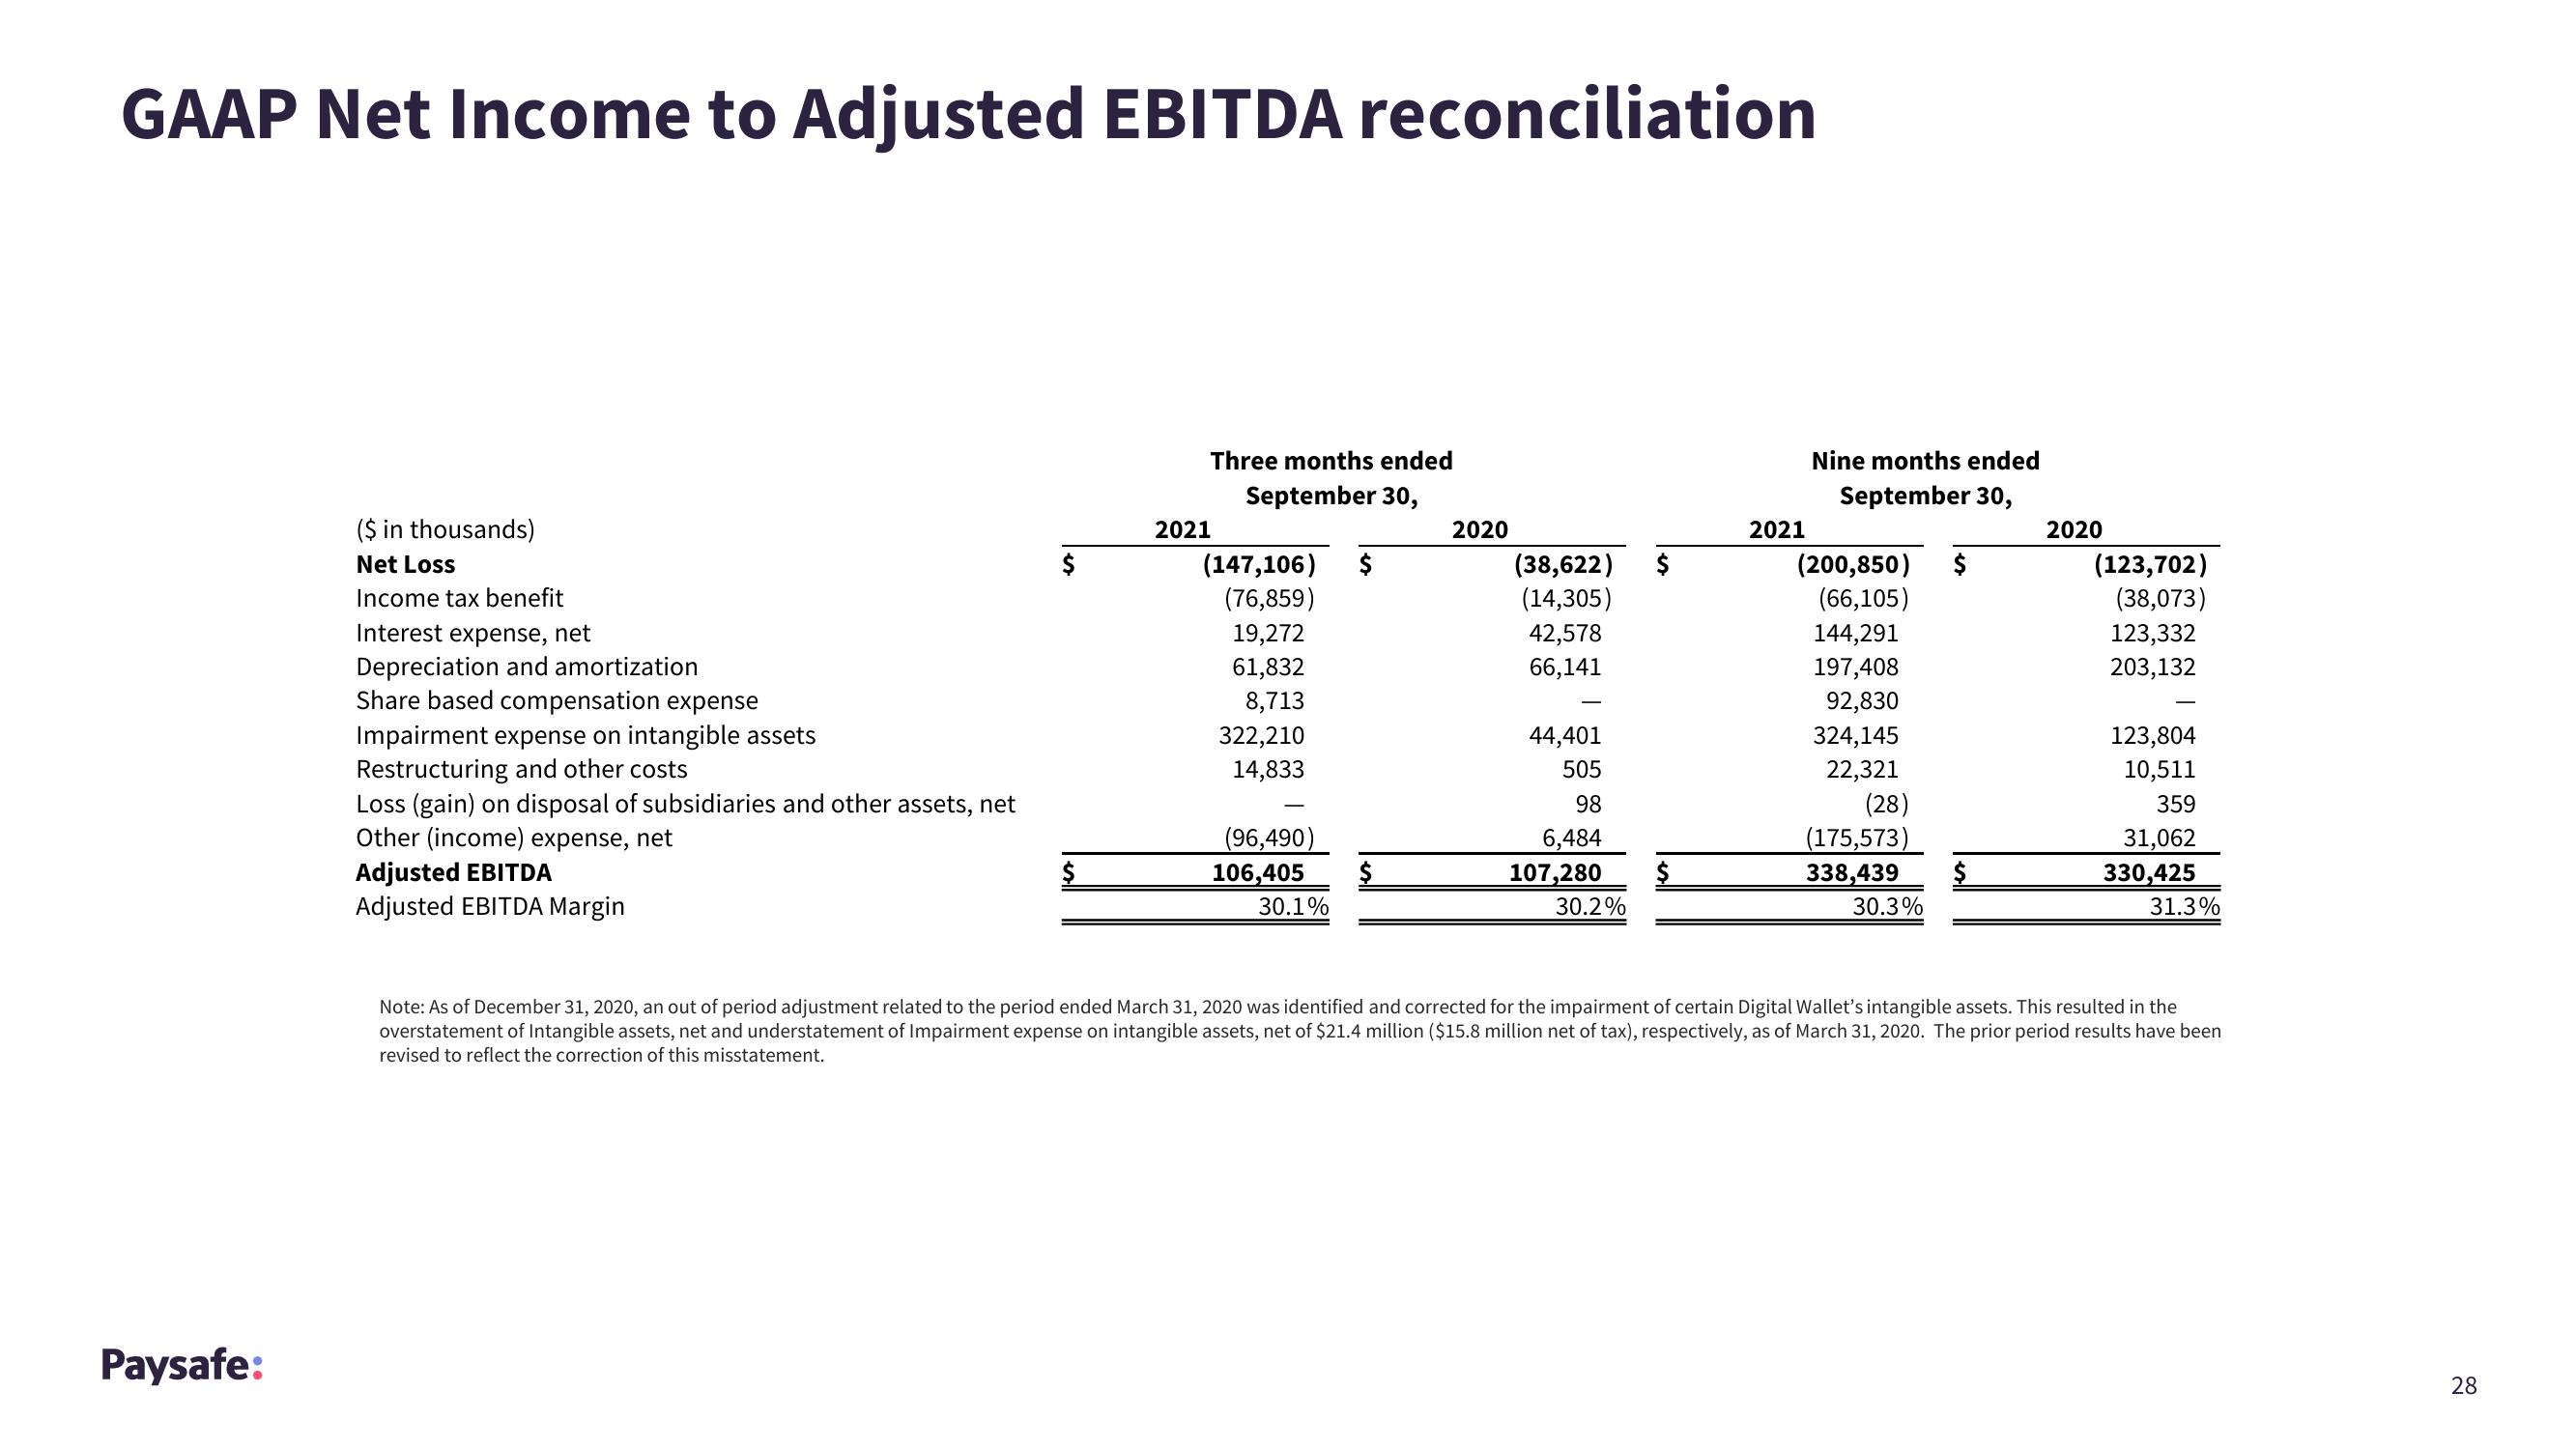
GAAP Net Income to Adjusted EBITDA reconciliation
Paysafe:
($ in thousands)
Net Loss
Income tax benefit
Interest expense, net
Depreciation and amortization
Share based compensation expense
Impairment expense on intangible assets
Restructuring and other costs
Loss (gain) on disposal of subsidiaries and other assets, net
Other (income) expense, net
Adjusted EBITDA
Adjusted EBITDA Margin
$
Three months ended
September 30,
2021
(147,106)
(76,859)
19,272
61,832
8,713
322,210
14,833
(96,490)
106,405
30.1%
$
$
2020
(38,622)
(14,305)
42,578
66,141
44,401
505
98
6,484
107,280
30.2%
2021
Nine months ended
September 30,
(200,850)
(66,105)
144,291
197,408
92,830
324,145
22,321
(28)
(175,573)
338,439
30.3%
$
$
2020
(123,702)
(38,073)
123,332
203,132
123,804
10,511
359
31,062
330,425
31.3%
Note: As of December 31, 2020, an out of period adjustment related to the period ended March 31, 2020 was identified and corrected for the impairment of certain Digital Wallet's intangible assets. This resulted in the
overstatement of Intangible assets, net and understatement of Impairment expense on intangible assets, net of $21.4 million ($15.8 million net of tax), respectively, as of March 31, 2020. The prior period results have been
revised to reflect the correction of this misstatement.
28View entire presentation