Grove Investor Presentation Deck
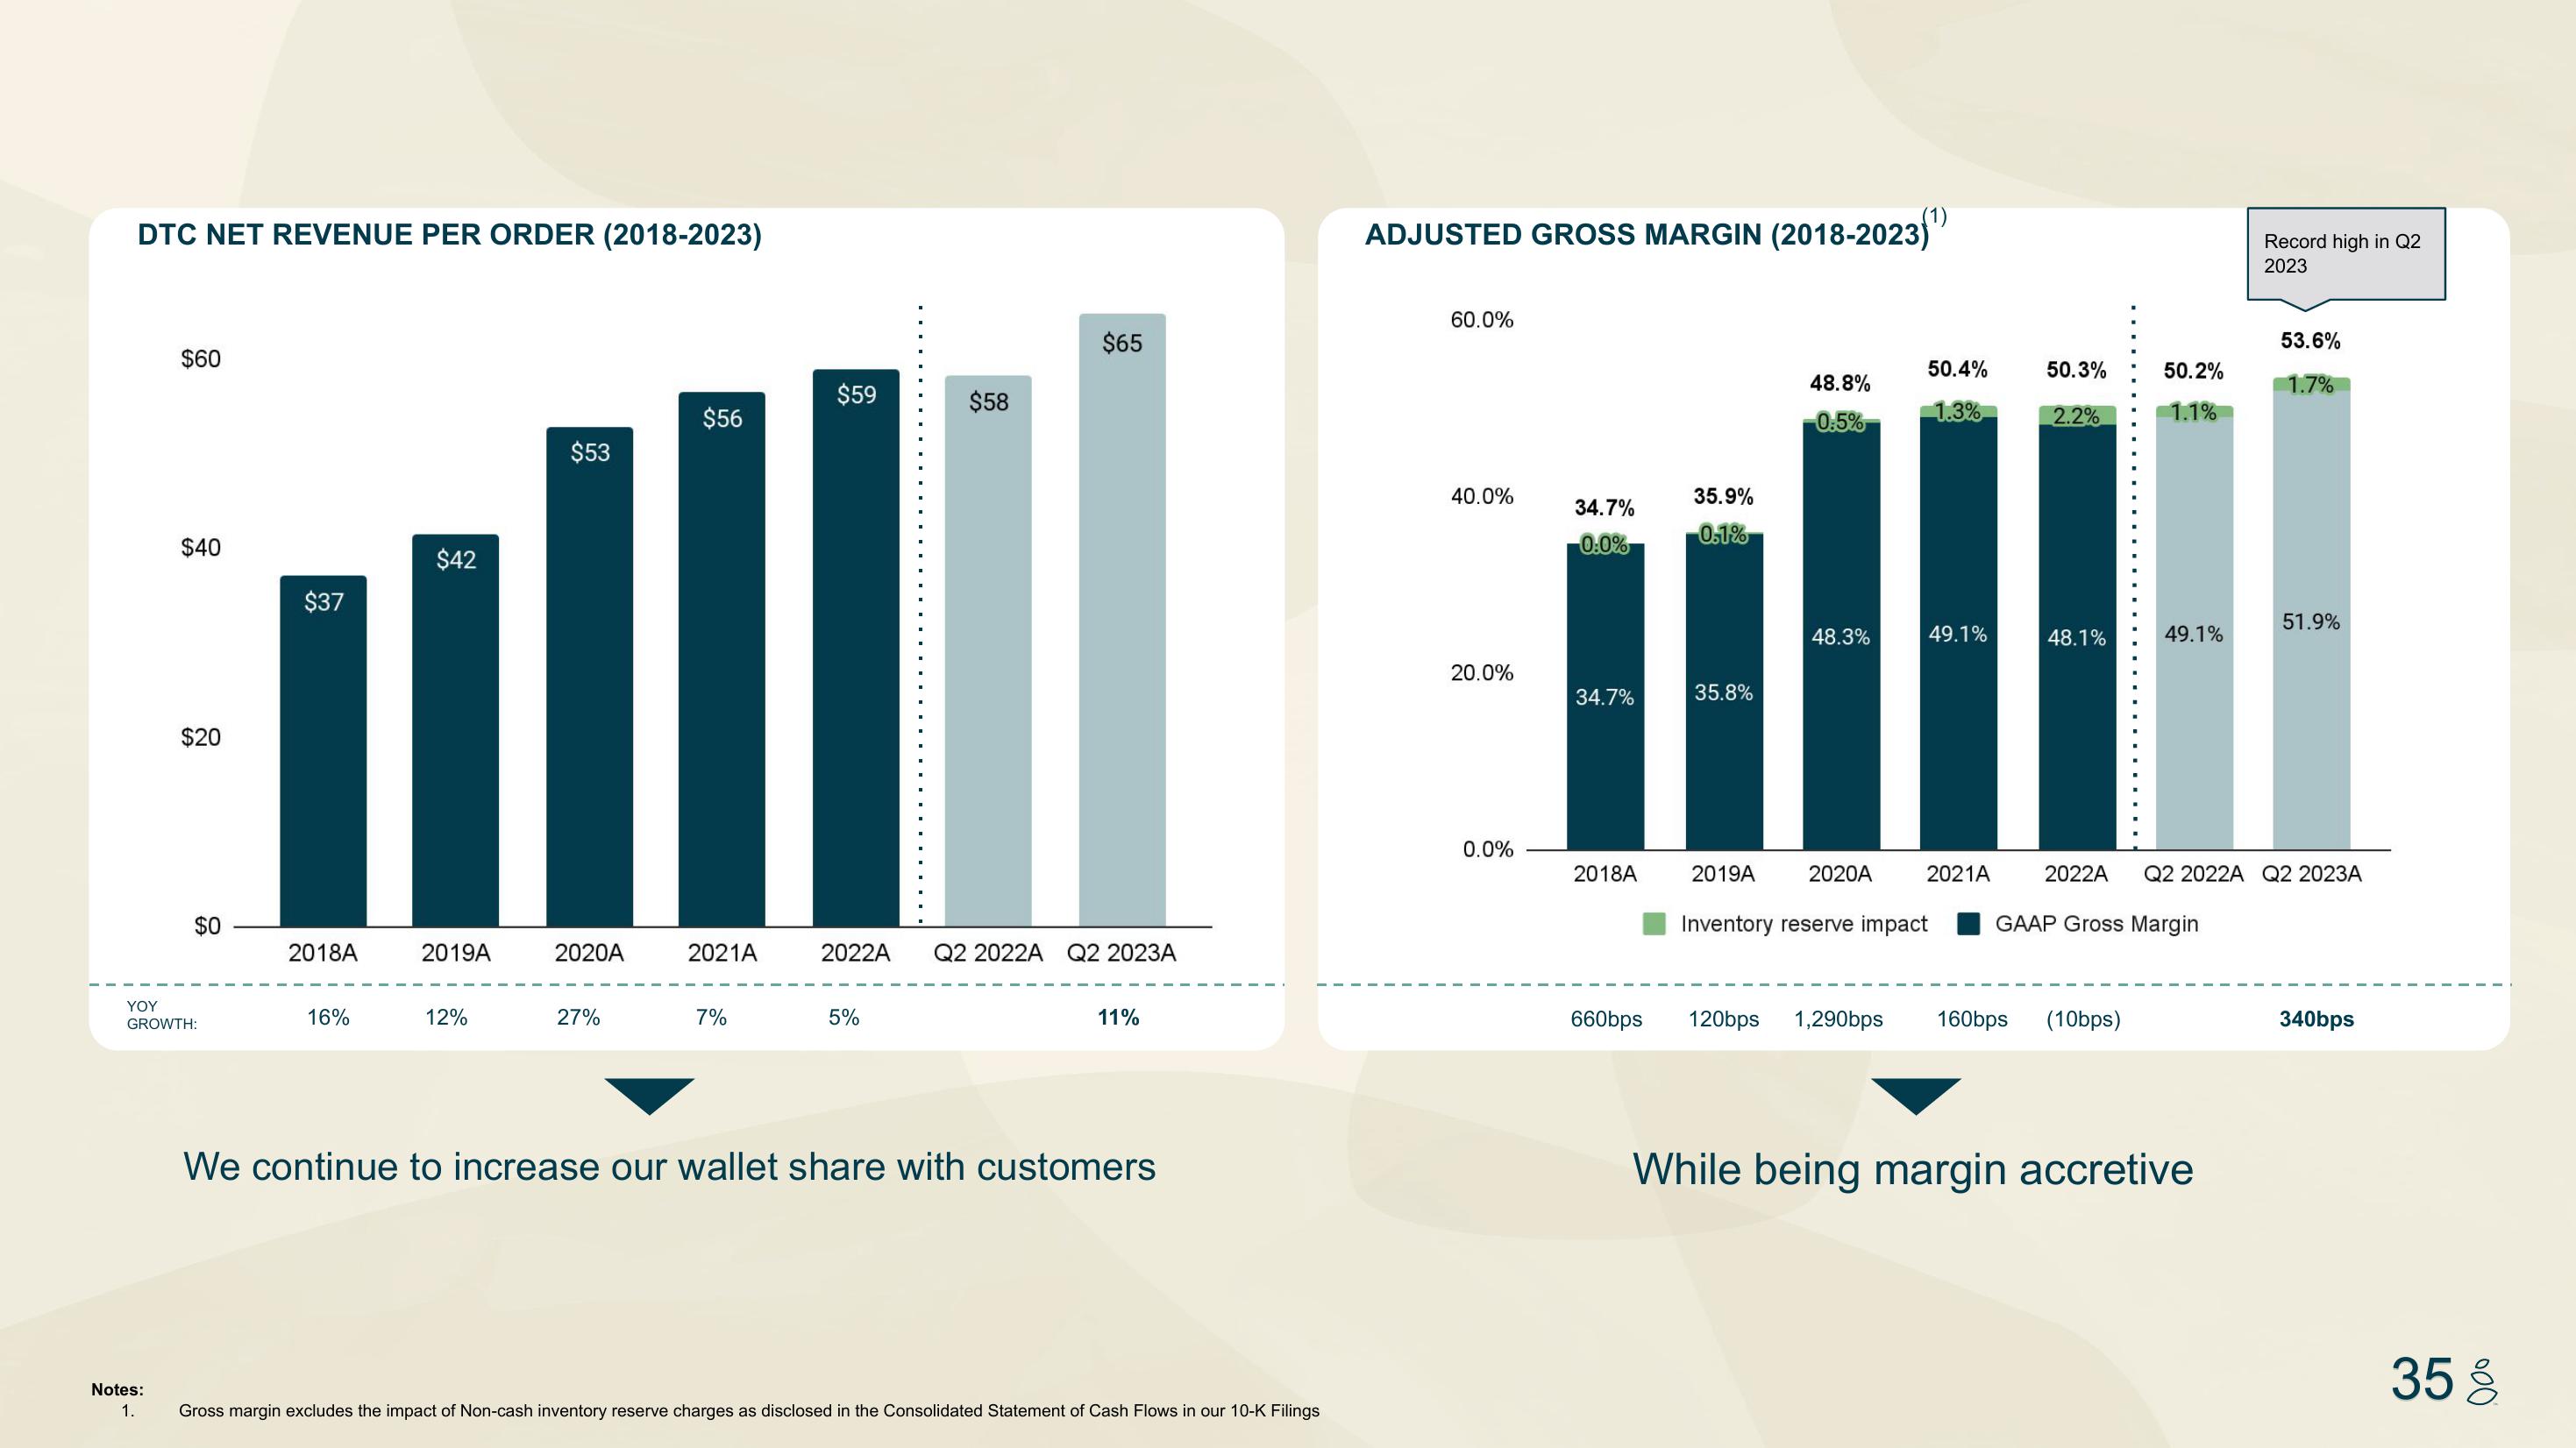
DTC NET REVENUE PER ORDER (2018-2023)
$60
$40
$20
$0
YOY
GROWTH:
$37
2018A
16%
$42
2019A
12%
$53
2020A
27%
$56
2021A
7%
$59
$58
5%
$65
2022A Q2 2022A Q2 2023A
11%
We continue to increase our wallet share with customers
Notes:
1. Gross margin excludes the impact of Non-cash inventory reserve charges as disclosed in the Consolidated Statement of Cash Flows in our 10-K Filings
ADJUSTED GROSS MARGIN (2018-2023)¹)
60.0%
40.0%
20.0%
0.0%
34.7%
0:0%
34.7%
2018A
660bps
35.9%
0.1%
35.8%
2019A
48.8%
0:5%
48.3%
2020A
50.4%
1.3%
49.1%
2021A
Inventory reserve impact
50.3%
2.2%
48.1%
50.2%
1.1%
49.1%
120bps 1,290bps 160bps (10bps)
GAAP Gross Margin
Record high in Q2
2023
2022A Q2 2022A Q2 2023A
While being margin accretive
53.6%
1.7%
51.9%
340bps
35 %View entire presentation