WeWork Investor Presentation Deck
Improved portfolio operations
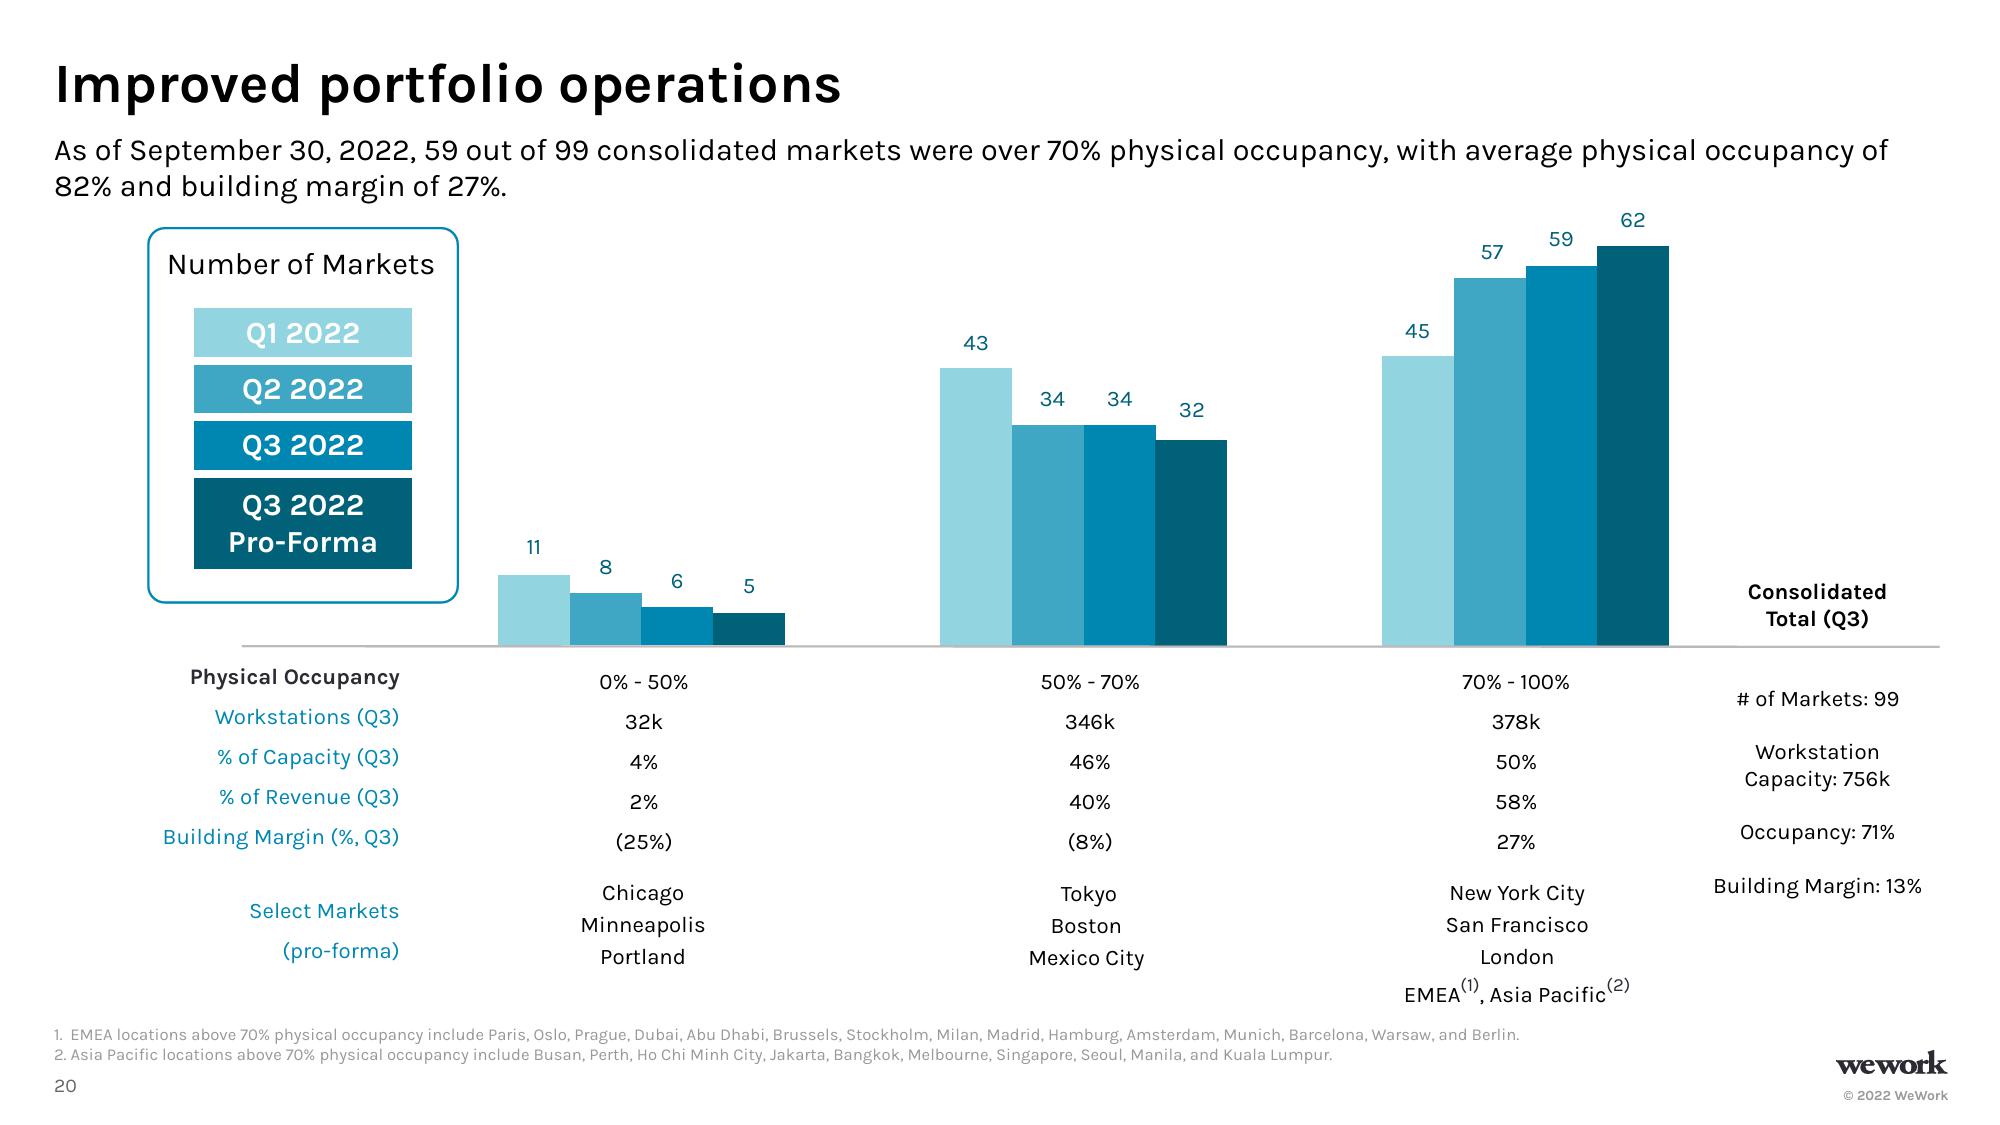
As of September 30, 2022, 59 out of 99 consolidated markets were over 70% physical occupancy, with average physical occupancy of
82% and building margin of 27%.
Number of Markets
Q1 2022
Q2 2022
Q3 2022
Q3 2022
Pro-Forma
Physical Occupancy
Workstations (Q3)
% of Capacity (Q3)
% of Revenue (Q3)
Building Margin (%, Q3)
Select Markets
(pro-forma)
11
8
6
0% - 50%
32k
4%
2%
(25%)
Chicago
Minneapolis
Portland
5
43
34
34
50% -70%
346k
46%
40%
(8%)
Tokyo
Boston
Mexico City
32
45
57
70% - 100%
378k
50%
58%
27%
59
New York City
San Francisco
1. EMEA locations above 70% physical occupancy include Paris, Oslo, Prague, Dubai, Abu Dhabi, Brussels, Stockholm, Milan, Madrid, Hamburg, Amsterdam, Munich, Barcelona, Warsaw, and Berlin.
2. Asia Pacific locations above 70% physical occupancy include Busan, Perth, Ho Chi Minh City, Jakarta, Bangkok, Melbourne, Singapore, Seoul, Manila, and Kuala Lumpur.
20
62
London
EMEA(1), Asia Pacific (2)
Consolidated
Total (Q3)
# of Markets: 99
Workstation
Capacity: 756k
Occupancy: 71%
Building Margin: 13%
wework
Ⓒ2022 WeWorkView entire presentation