Nuvei Results Presentation Deck
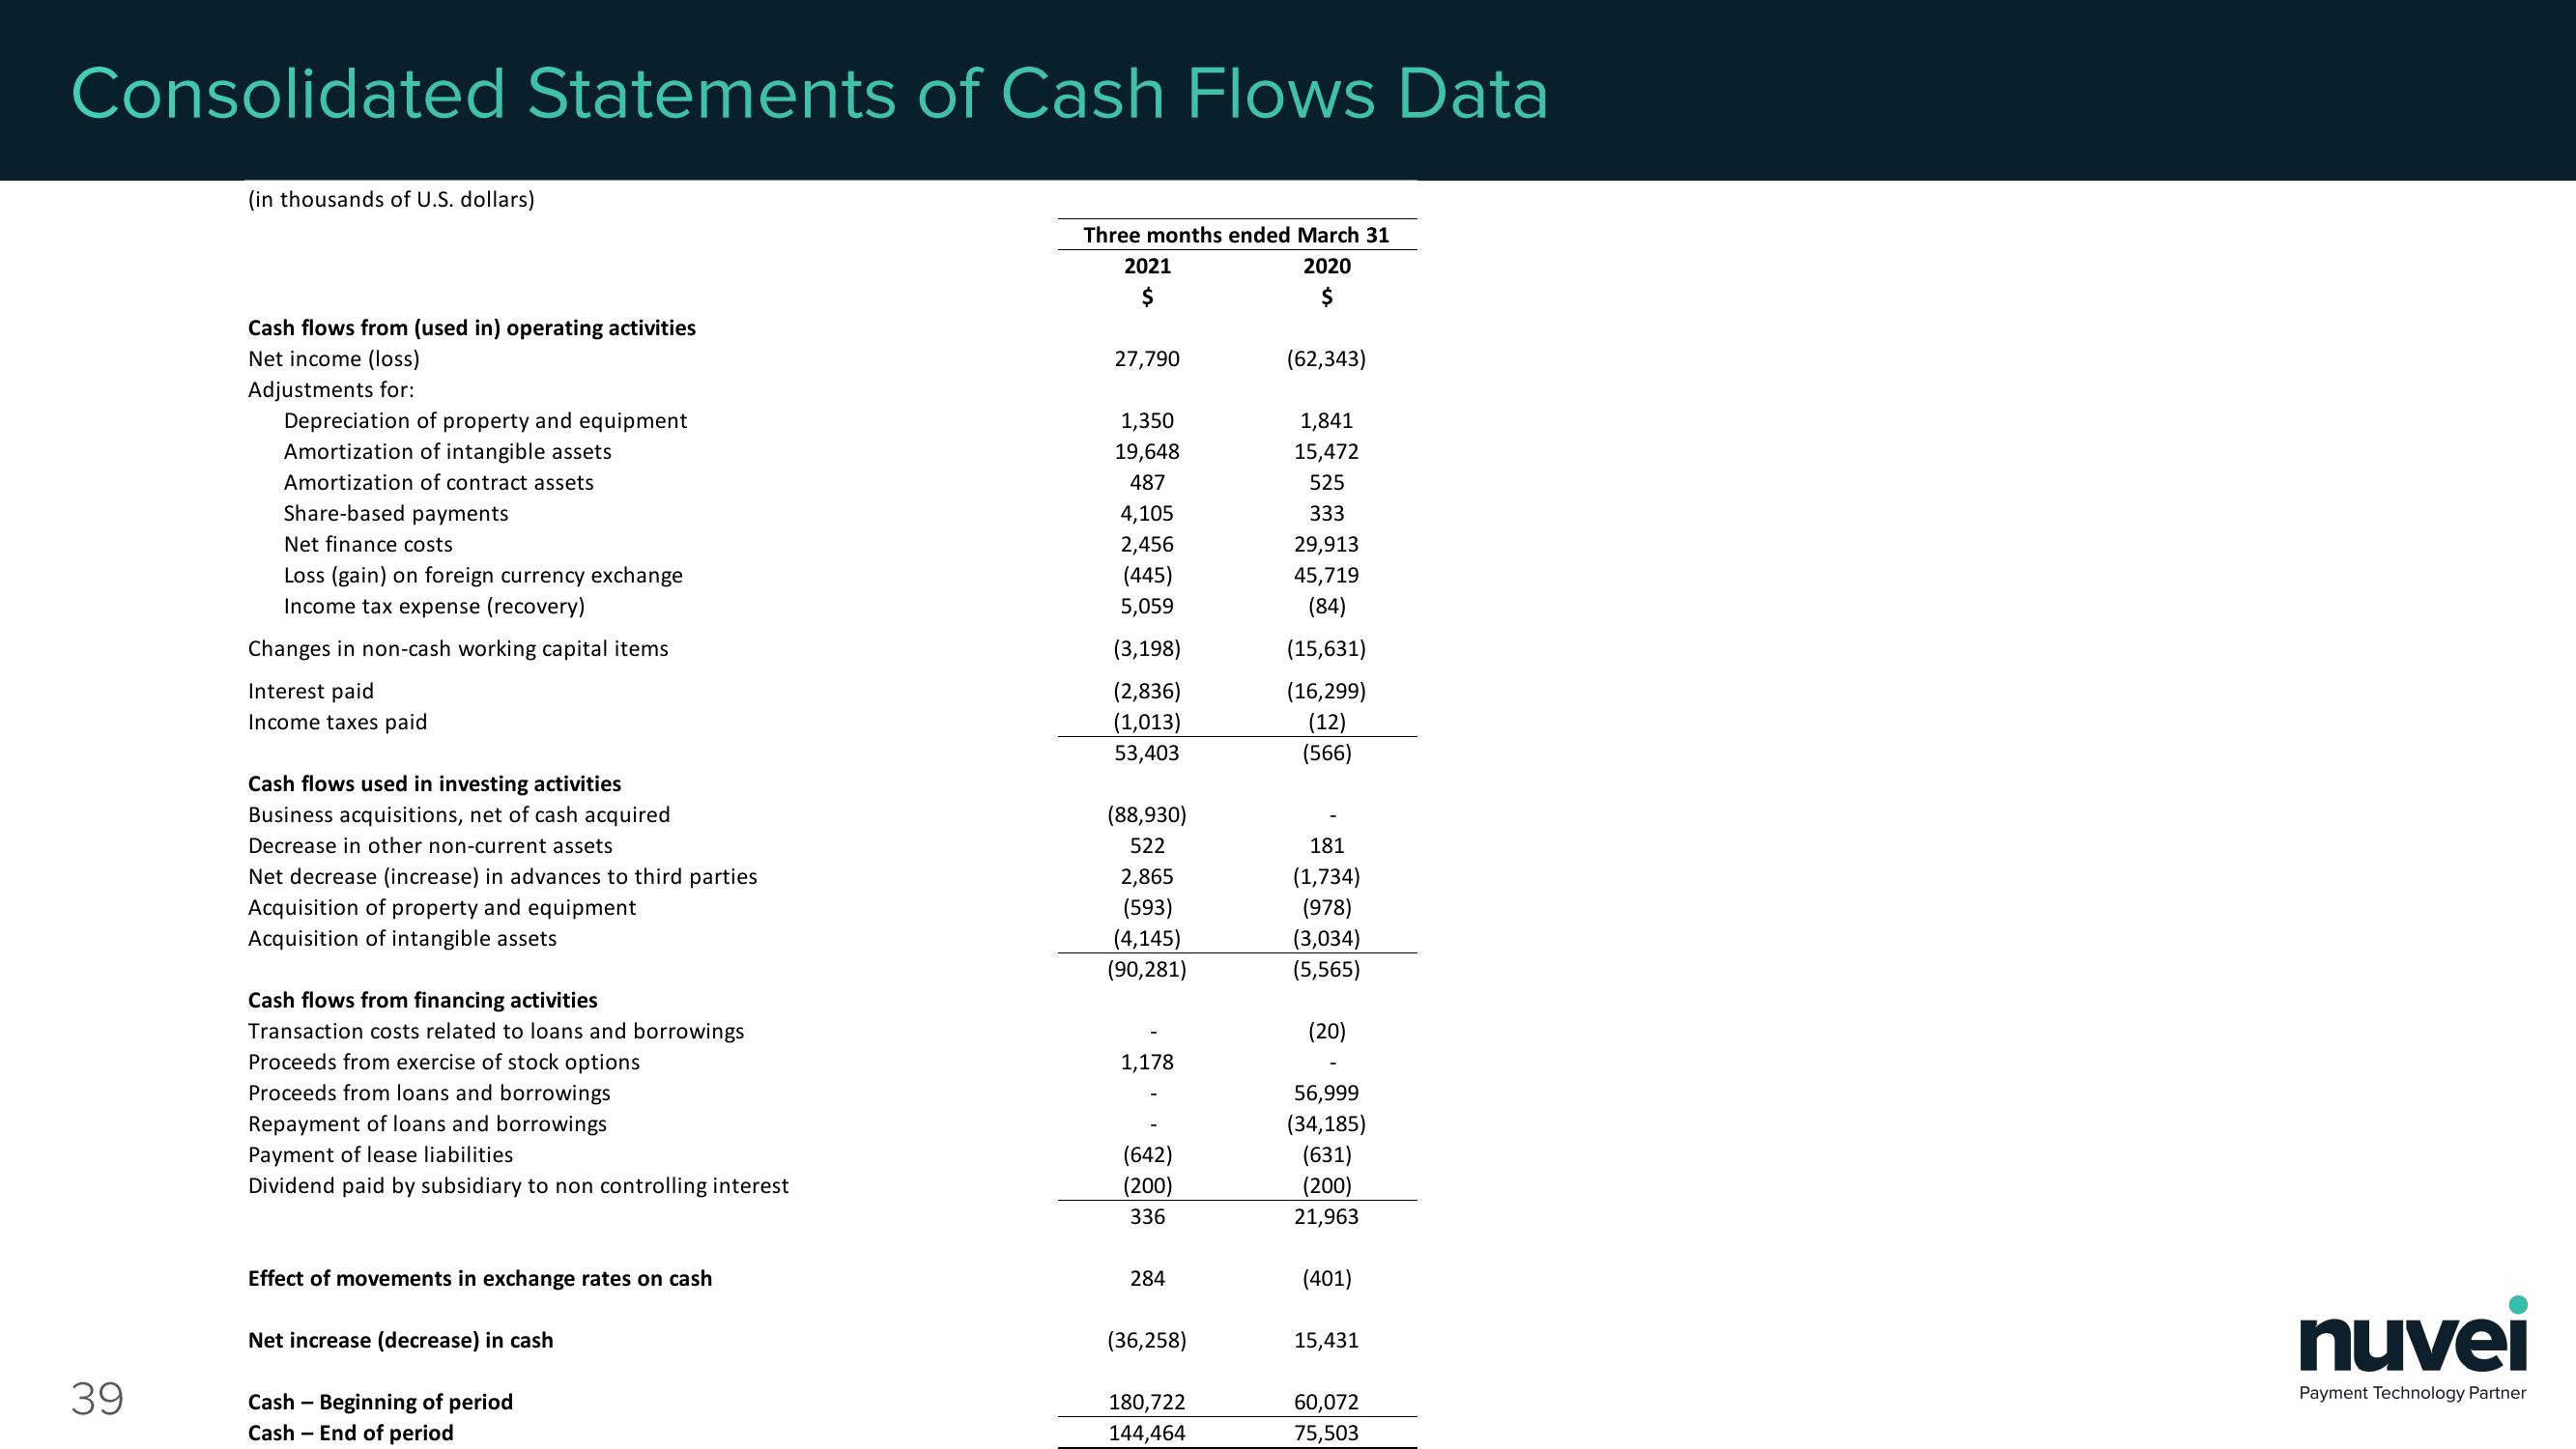
Consolidated Statements of Cash Flows Data
39
(in thousands of U.S. dollars)
Cash flows from (used in) operating activities
Net income (loss)
Adjustments for:
Depreciation of property and equipment
Amortization of intangible assets
Amortization of contract assets
Share-based payments
Net finance costs
Loss (gain) on foreign currency exchange
Income tax expense (recovery)
Changes in non-cash working capital items
Interest paid
Income taxes paid
Cash flows used in investing activities
Business acquisitions, net of cash acquired
Decrease in other non-current assets
Net decrease (increase) in advances to third parties
Acquisition of property and equipment
Acquisition of intangible assets
Cash flows from financing activities
Transaction costs related to loans and borrowings
Proceeds from exercise of stock options
Proceeds from loans and borrowings
Repayment of loans and borrowings
Payment of lease liabilities
Dividend paid by subsidiary to non controlling interest
Effect of movements in exchange rates on cash
Net increase (decrease) in cash
Cash Beginning of period
Cash End of period
Three months ended March 31
2021
$
2020
$
27,790
1,350
19,648
487
4,105
2,456
(445)
5,059
(3,198)
(2,836)
(1,013)
53,403
(88,930)
522
2,865
(593)
(4,145)
(90,281)
1,178
(642)
(200)
336
284
(36,258)
180,722
144,464
(62,343)
1,841
15,472
525
333
29,913
45,719
(84)
(15,631)
(16,299)
(12)
(566)
181
(1,734)
(978)
(3,034)
(5,565)
(20)
56,999
(34,185)
(631)
(200)
21,963
(401)
15,431
60,072
75,503
nuvei
Payment Technology PartnerView entire presentation